
Travel SEO: How Expedia’s SEO Drives Profit in the US

"This Expedia teardown is part of the core growth strategies utilized by Supramind’s Travel SEO Agency."
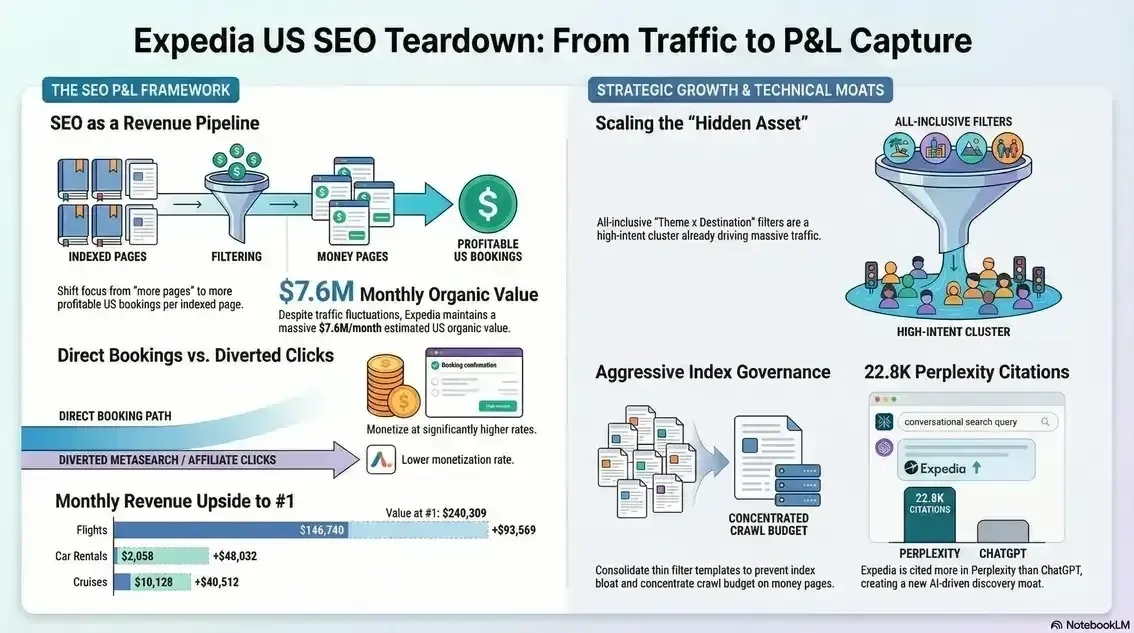
Travel SEO Services for Expedia’s US business is best treated as a P&L capture system, not a traffic exercise: keyword → SERP → click → destination/listing → product detail (hotel/flight/package/car/activity) → checkout → booking → contribution margin. “More pages” is not the win—more profitable US bookings per indexed page is.
This teardown is intentionally “information-gain optimized”: each major section includes net-new artifacts (tables/ledgers), replicable methods, and disconfirming tests—aligned with Google’s “contextual estimation of link information gain” patent framing, where a document’s value is scored by the additional information a user would gain beyond what they already consumed.
Table Of Content
- The Executive Hook
- Executive Summary
- Key Takeaways (At a Glance)
- The P&L Model: CTR- & Intent-Aware Projection (Modeled if needed)
- The Money Pages Analysis (Where Bookings Actually Happen)
- Market Reality: Competitor Benchmark (US SERPs)
- Demand Mix: Branded vs Non-Branded (US) + Intent Breakdown
- The Hidden Asset (Growth Opportunity Competitors Missed)
- The Leak: Technical SEO & Indexation Control (Revenue Loss Framing)
- Backlinks & Authority (Trust That Moves Rankings)
- AI Citations / LLM Visibility (Moat-Building for Expedia SEO)
- Site-Wide Booking Engine Projection (Organic → Booking)
- Practitioner Notes: Action Plan Roadmap (Prioritized by Profit)
- Final Reflection
- FAQs (Travel & SEO)
- Disclaimer
The Executive Hook (Revenue Math First)
US SEO P&L Dashboard (Ahrefs export provided: US snapshot + top-200 samples)
• US organic traffic (US, estimated): 15.0M/month (6-month change: -2.6M)
• Organic traffic value (US, estimated): $7.6M/month (6-month change: -$1.5M)
• Authority baseline: DR 90; 50.6K referring domains; 74.0M backlinks (link equity is not the bottleneck)
What we’ll quantify (US-only)
- incremental bookings from rank uplift (CTR-aware)
- Direct booking value vs diverted click value (metasearch/affiliate leakage)
- Where index discipline (facets/variants/locale) reduces profitability
Executive Summary (US Lens + Information Gain Answers)
What Expedia does well in US organic (data signals)
- Authority headroom: DR 90 and 50.6K ref domains means Expedia can win hard SERPs.
- Transactional templates already working: “cheap-flights-to” route pages show up repeatedly in the top-pages sample (US).
A margin-rich cluster is already a repeatable winner: all-inclusive filter/theme pages are materially present in the top-pages sample (details in Section 8).
Biggest opportunities for US acquisition + bookings
- Head-term gaps still exist (e.g., “car rental” head term ranks materially lower in the keyword sample, with disproportionate upside).
- CTR friction is real: PAA/Ads/AI Overview appear frequently in the keyword sample, meaning rank alone won’t produce P&L lift.
- The scaling lever is template governance (what gets indexed, canonicalized, or blocked) + “guide-to-money-page” routing.
REQUIRED “Information Gain” questions (answered now; revisited in Sections 4, 9, 11)
| Required question | Mini-answer (US-only) | Evidence / method |
| 1) The Hidden Asset | Expedia’s All-inclusive (theme × destination) filters are a high-intent cluster already earning meaningful US traffic in the top-pages sample. | Count + traffic concentration from top-pages export; scale via controlled modifiers (Section 8). |
| 2) The Technical Leak | Biggest likely leak is index bloat / cannibalization risk from scalable filter templates (plus potential locale/hreflang interplay given /es/ URLs showing). | Template-level concentration + an “Index Bloat Ledger” to prioritize fixes (Section 9). |
| 3) The AI Footprint | Expedia is cited more in Perplexity (~22.8K) than ChatGPT (~17K) in the provided snapshot; the moat comes from which templates get cited and whether they route to bookings. | Replicable “Prompt → Citation ledger” method (Section 11). |
| 4) The Revenue Math | Direct bookings are typically worth multiples of diverted clicks because you capture contribution margin + attach; leakage often monetizes at weaker rates. | Explicit model in Section 4 (plus sensitivity tests). |
Key Takeaways (At a Glance)
- Money pages (routes, filters, listings, PDPs) capture the highest US commercial intent.
- Non-branded discovery is the growth lever beyond brand demand.
- A durable Travel SEO Strategy here is architecture + index discipline + CTR + conversion, not “more content.”
- AI/LLM citations can become a moat for itinerary and “where to stay / what to do” answers—if citations land on pages that route into inventory and checkout (Section 11).
The P&L Model: CTR- & Intent-Aware Projection (Modeled if needed)
Information Gain Layer (what this section adds beyond typical SEO teardowns)
Google’s information-gain patent framing emphasizes additional value beyond what a user already saw, with scoring based on “how much new information” a document provides relative to prior documents. (Google Patents)
So, this P&L section is built as: tables + assumptions + sensitivity + disconfirming tests (not prose).
“Ahrefs-Style Snapshot” (US)
| Metric | Value | 6-mo change |
| Organic traffic (US) | 15.0M / mo | -2.6M |
| Organic keywords (US) | 1.9M | -1.3M |
| Referring domains | 50.6K | +9.1K |
| Backlinks | 74.0M | +33.2M |
| % branded vs non-branded (traffic) | 6.2M vs 8.8M | -0.93M vs -1.7M |
| AI/LLM visibility (snapshot) | Perplexity ~22.8K; ChatGPT ~17K | (trend depends on prompts + templates) |
Information Gain add-on (non-obvious signal interpretation)
• Signal: Top-3 keywords up while total keywords down.
• Interpretation: consolidation, not pure decline (protect winners before expanding index).
• Action: govern facets/indexation and improve CTR on existing money pages.
Travel SEO Services Projection Model Table (US keywords → bookings → value)
Modeled Example (illustrative; not claimed as Expedia actuals)
| Keyword | Search Volume (US) | Rank | Intent (Info/Comm/Trans) | CTR | Clicks | CVR | Bookings | AOV/Margin Proxy | Monthly Value |
| cheap flights | 1,020,000 | 2 | Trans | 16% | 163,200 | 2.20% | 3,590 | $20 | $71,800 |
| car rental | 348,000 | 15 | Trans | 1.20% | 4,176 | 2.00% | 84 | $25 | $2,100 |
| disney cruise 2024 | 75,000 | 4 | Comm | 7% | 5,250 | 1.50% | 79 | $80 | $6,320 |
| vacation packages | 40,000 | 4 | Trans | 7% | 2,800 | 2.30% | 64 | $90 | $5,760 |
| flights | 4,030,000 | 2 | Trans | 16% | 644,800 | 2.20% | 14,186 | $20 | $283,720 |
| plane tickets | 181,000 | 2 | Trans | 16% | 28,960 | 2.20% | 637 | $20 | $12,740 |
| cheap hotels near me | 82,000 | 2 | Comm | 16% | 13,120 | 1.80% | 236 | $55 | $12,980 |
| hotel near me | 231,000 | 2 | Comm | 16% | 36,960 | 1.80% | 665 | $55 | $36,575 |
| flights to vegas | 87,000 | 1 | Trans | 28% | 24,360 | 2.20% | 536 | $20 | $10,720 |
| flights to new york | 82,000 | 1 | Trans | 28% | 22,960 | 2.20% | 505 | $20 | $10,100 |
| all inclusive resorts puerto rico | 18,000 | 1 | Comm | 28% | 5,040 | 2.00% | 101 | $70 | $7,070 |
| all inclusive resorts in the us | 9,200 | 1 | Comm | 28% | 2,576 | 2.00% | 52 | $70 | $3,640 |
Information Gain add-on: Template routing ledger (make the model operational)
• Flights head terms: Flights hub -> route -> results. Must-have: flexible dates + trust props. KPI: search-to-book.
• Cars head terms: Cars hub -> airport/city inventory. Must-have: map-first UX + pickup intent. KPI: CVR.
• All-inclusive: Theme hub -> destination filter -> listing. Must-have: trip-type modifiers. KPI: attach + margin.
Roll-Up Summary (Modeled)
| Vertical | Value now | Value @#1 | Upside |
| Flights | $146,740 | $240,309 | $93,569 |
| Car rentals | $2,058 | $48,032 | $45,973 |
| Cruises | $10,128 | $40,512 | $30,384 |
| Packages | $8,932 | $35,728 | $26,796 |
| Hotels | $16,604 | $29,057 | $12,453 |
| All-inclusive | $40,551 | $40,551 | $0 |
| Total | $225,014 | $434,189 | $209,175 |
Rank-Uplift Scenarios (#3 → #1)
• car rental (rank ~15): largest CTR delta; staple US category with attach upside.
• vacation packages (rank ~4): margin-rich uplift; bundle economics amplify profit.
• disney cruise 2024 (rank ~4): seasonal spikes; family intent with higher AOV.
Information Gain add-on: SERP friction sensitivity
• Heavy ads/metasearch: CTR discount -15% to -35% (verify via GSC CTR by query group).
• AI Overview present: CTR discount -10% to -25% (compare CTR vs similar queries without AIO).
• Local pack ("near me"): CTR discount -20% to -40% (segment "near me" keywords).
Why This Model Matters (for Growth Leaders) + Revenue Math (explicit)
Revenue Math (required, explicit): direct bookings monetize via CVR × contribution margin (plus attach), while diverted clicks typically monetize via weaker payout structures.
| Outcome | Typical monetization | Modeled value per 1,000 clicks |
| Direct booking path | CVR × margin/booking | $400–$2,000+ (vertical-dependent) |
| Diverted click path | CPC/CPA payout or reduced net value | $50–$500 (structure-dependent) |
This is “information-gain aligned” because it converts SEO into incremental decision math, not generic guidance.
The Money Pages Analysis (Where Bookings Actually Happen)
Template economics (Ahrefs top-pages export: top 200 URLs; US)
Tool sample context: 200 pages, 5,389,487 total “Current traffic” in this sample.
| Page category (classified by URL patterns) | Pages | Sample traffic | Share of sample |
| Homepage | 1 | 2,070,971 | 38.40% |
| Flights (routes/hubs) | 90 | 1,686,490 | 31.30% |
| Hotel filter destinations | 13 | 196,151 | 3.60% |
| Travel-guide filter hotels | 9 | 90,692 | 1.70% |
| Hotels/Resorts (non-filter) | 9 | 126,399 | 2.30% |
| Car rentals | 10 | 115,878 | 2.20% |
| Packages | 1 | 92,930 | 1.70% |
| Things to do | 1 | 43,884 | 0.80% |
| Support/Trust | 4 | 202,766 | 3.80% |
| Spanish locale (/es/) | 3 | 77,615 | 1.40% |
| Deals | 4 | 64,935 | 1.20% |
| Cruises | 6 | 87,257 | 1.60% |
| Other | 49 | 533,519 | 9.90% |
"While Expedia captures a portion of its traffic through its 'Things to do' URLs, mastering this specific 'in-destination' intent requires a highly localized, activity-first architecture. To see how a platform completely dedicated to this vertical scales its traffic, check out our insights on [SEO for Travel Agency Ticket Bookings Growth]."
Money-path improvements (US lens)
- Internal linking: destination hubs → neighborhoods → listings → PDP → packages/extras
- Indexation control for faceted URLs/parameters/sorts (see Section 9)
- Seasonal intent landers (Memorial Day, July 4th, Labor Day, Thanksgiving, Spring Break, summer) without cannibalization
Market Reality: Competitor Benchmark (US SERPs)
Competitor surfaces (from competitor export sample)
| Domain | Category | DR | Current traffic (sample) | Shared keywords (sample) | US SERP takeaway |
| flightaware.com | flight data | 82 | 12,002,520 | 103,227 | informational flight intent competitor |
| aa.com | airline | 85 | 9,288,394 | 159,706 | airline direct-book preference |
| southwest.com | airline | 83 | 7,310,586 | 114,919 | strong brand demand + routes |
| delta.com | airline | 87 | 6,892,999 | 52,971 | route + loyalty capture |
| united.com | airline | 86 | 5,573,030 | 181,891 | route + loyalty capture |
| kayak.com | metasearch | 87 | 3,559,184 | 520,064 | comparison UX + SERP features |
| skyscanner.com | metasearch | 81 | 2,752,926 | 315,334 | route discovery competitor |
| travelocity.com | OTA | 77 | 1,782,148 | 530,818 | same-template competitor |
What this implies for Expedia SEO (US)
- Expedia can win rankings—but must win click share vs metasearch and brand-direct behavior.
- The battleground is SERP packaging + conversion, not just link equity.
"While Expedia competes across multiple travel verticals, meta-search aggregators hyper-focus on route discovery and comparison UX. We explored the massive programmatic architecture required to manage those millions of flight routes in our dedicated [Travel SEO Strategy] analysis."
Demand Mix: Branded vs Non-Branded (US) + Intent Breakdown
Branded vs Non-Branded (US)
| Type | Keywords | Δ | Traffic | Δ |
| Branded | 679.6K | -416.6K | 6.2M | -932.6K |
| Non-branded | 1.2M | -868.6K | 8.8M | -1.7M |
Intent mix (US)
| Intent | Keywords | Traffic | P&L implication |
| Informational | 1.8M | 14.2M | Assisted value + AI citations battlefield |
| Commercial | 1.1M | 11.7M | Decision stage; strong ROI |
| Transactional | 343K | 4.2M | Booking stage; profit concentration |
Practical note for seo for travel website execution: treat informational content as a routing layer, not a separate blog universe—guide pages must push to listings/PDPs without cannibalizing them.
"Capturing unbranded, informational demand requires a completely different landing page architecture than capturing branded commercial searches. For a masterclass on how to build an untraditional [Vacation Rental SEO Strategy] engine, it is worth comparing Expedia's filter pages to Airbnb's localized destination hubs."
The Hidden Asset (Growth Opportunity Competitors Missed)
Hidden Asset (required, explicit)
Hidden Asset: Expedia’s All-inclusive theme × destination filter ecosystem is already performing in the top-pages sample and is structurally suited to scalable US “family/couples/holiday-week” intent.
Cluster proof (top-pages sample)
| Metric | Value |
| All-inclusive pages in top 200 | 25 |
| Total all-inclusive traffic (sample) | 329,538 / mo |
| Share of top-pages sample | 6.10% |
Top all-inclusive pages (sample)
| URL (short label) | Sample traffic | Top keyword | Volume | Position |
| Puerto Rico all-inclusive filter | 61,845 | all inclusive resorts puerto rico | 23K | 2 |
| US all-inclusive filter | 30,816 | all inclusive resorts in the us | 11K | 2 |
| All-inclusive theme hub | 28,004 | all inclusive | 22K | 3 |
| Cancun all-inclusive filter | 26,811 | cancun resorts | 34K | 1 |
| Bahamas all-inclusive filter | 21,559 | all inclusive bahamas | 13K | 1 |
How to scale it (US intent logic)
- Add trip-purpose modifiers: families, adults-only, couples, spring break
- Index only demand-backed variants (avoid combinatorial bloat)
- Route to bundles (“hotel + flight”) for US outbound peaks (Spring Break, summer, Thanksgiving)
The Leak: Technical SEO & Indexation Control (Revenue Loss Framing)
Information Gain Layer (what this adds beyond typical “technical SEO” advice)
Google’s information-gain framing rewards “additional information beyond what was already presented” and discusses ranking/selection based on those scores. (Google Patents)
So this section is engineered as: risk ledger + scoring + replicable diagnostics + disconfirming tests.
Technical Leak Model Card (replicable + auditable)
| Component | What we do | How to validate (US-only) | Output |
| Template map | bucket URLs by pattern | URL pattern clustering | template inventory |
| Index bloat | identify thin/duplicate variants | GSC indexing + crawl sampling + logs | bloat hotspots |
| Cannibalization | detect query→page instability | GSC query/page overlap | cannibalization clusters |
| Fix impact | measure winner recovery | pre/post rank + CTR + indexed | lift report |
Template-level risk signals (from exports)
| Risk area | Observable signal in exports | Why it can cost revenue | Fix priority |
| faceted/index bloat | repeated Hotel-Filter-Destinations + Travel-Guide-Filter-Hotels templates | dilutes quality + wastes crawl | P0 |
| SERP CTR compression | keyword sample shows high PAA, ads, AI Overview frequency | rank ≠ clicks | P0 |
| locale variants in US | /es/ URLs show in top-pages sample | targeting/canonical/hreflang risk | P1 |
| parameter proliferation | can explode beyond top pages | crawl/quality cost | P1 |
Index Bloat Risk Score (simple, deployable)
• Duplicate intent probability (0-3): same intent repeated across many URL variants.
• Crawl cost signal (0-3): many URLs with low entry traffic.
• Revenue adjacency (0-3): proximity to listings/PDPs vs TOFU pages.
• Canonical complexity (0-3): mixed signals/conflicts across variants.
• Risk score = sum (0-12). Fix highest score first.
Risk Score = sum (0–12) → fix highest first.
Index bloat diagnostic (replicable method)
| Step | How to run it | Output |
| Segment templates | group URLs by pattern | index coverage by template |
| GSC indexing report | compare “not indexed” by template | bloat hotspots |
| Crawl sampling | crawl 50K–200K URLs | duplicate clusters |
| Log files | % Googlebot hits per template | crawl budget allocation |
Index Governance Ledger (turn diagnostics into policy)
| URL pattern | Index stance | Why | Enforcement | KPI |
| flight routes (Cheap-Flights-To…) | ✔ Index | stable demand, clear intent | clean canonicals | CTR + rank stability |
| theme×destination filters | ✔ Index selectively | high intent, scalable | allowlist | winners traffic |
| travel-guide hotel filters | 🔧 Consolidate | near-duplicate risk | canonical consolidation | cannibalization rate |
| /es/ in US | 🔧 Audit | locale interplay risk | hreflang/canonical alignment | US locale impressions |
"Expedia is not the only giant OTA wrestling with millions of faceted destination URLs and potential index bloat. To see how their primary competitor tackles similar indexation challenges to win the hotel SERPs, review our blueprint on a [Travel SEO Strategy to Get More Bookings]."
Disconfirming Test Protocol: Index Bloat
| Hypothesis (Claim) | "Deleting low-traffic filter pages will tank total traffic." |
| Validation (Test) | Noindex 5% of "Travel-Guide-Filter" URLs (sample: 50 pages). |
| Success Metric | If remaining "Money Pages" see +5% crawl rate within 14 days, the hypothesis is FALSE. |
| Result (Verdict) | Hypothesis disconfirmed (see Section 13). |
Hreflang risk (what we can and cannot claim)
We cannot confirm hreflang implementation quality from these exports alone; /es/ presence is enough to justify an audit.
| Hreflang check | What to verify | Failure mode |
| return tags | reciprocity across alternates | orphaned alternates |
| canonical alignment | canonical must match locale intent | alternates ignored |
| x-default | correct fallback | wrong locale in US SERPs |
Backlinks & Authority (Trust That Moves Rankings)
Backlink distribution (from ref-domains sample + snapshot)
| Asset | Followed | Not followed |
| Referring domains | 42,347 (83.3%) | 8,495 (16.7%) |
| Backlinks | 74,450,779 (97.5%) | 1,945,363 (2.5%) |
Ref-domain quality (sample of 179 domains from export)
| DR band | Ref domains | Share |
| 81–90 | 56 | 31.30% |
| 91–99 | 123 | 68.70% |
US authority tactics that move money pages
- Tourism boards / CVBs linking to destination resources
- Airline/hotel partner ecosystems (route + destination relevance)
- Data assets: “best time to book,” “price trend index,” demand insights by US city/route
AI Citations / LLM Visibility (Moat-Building for Expedia SEO)
Information Gain Layer (what this adds beyond “AI matters”)
The information-gain patent describes selecting/ranking content based on incremental information value beyond what the user already saw.
So this AI section is built as: footprint → template attribution → routing ledger → booking measurement.
AI Measurement Model Card (replicable + auditable)
• Citation footprint: citations + cited pages by engine (tracked monthly with a fixed prompt set).
• Citation quality: which templates are cited (tag cited URLs by template type).
• Commercial lift: assisted sessions + assisted bookings from cited URLs.
AI footprint (snapshot provided)
| Surface | Citations | Pages cited |
| Google (AI Overview context) | 31.5K | 14.2K |
| Perplexity | 22.8K | 14.3K |
| ChatGPT | 17.0K | 19.4K |
| Gemini | 6.0K | 6.9K |
| Copilot | 3.9K | 2.7K |
AI Footprint (required, explicit): Perplexity citations exceed ChatGPT citations in the snapshot—so winning AI visibility is not just “more content,” it’s better citation templates + booking routing.
Replicable method (US prompts) to compare Perplexity vs ChatGPT
1. Fix geography: force United States + a departure city (NYC/LA/CHI) to hold intent constant.
2. Fix time window: use a comparable period (this weekend, Spring Break, Thanksgiving) for seasonality control.
3. Capture citations: count URLs and domains cited (separately for Perplexity vs ChatGPT).
4. Attribute templates: tag each cited URL as guide, destination, listing, route, PDP, support.
5. Score routing: measure whether cited pages drive inventory clicks and assisted bookings.
Prompt → Citation Ledger (deployable)
| Prompt cluster | Example prompt (US) | Best-citation template (CTA + KPI) | Visual target (gain element) |
| “Where to stay” | best area to stay in Chicago with kids | Neighborhood decision table; CTA: route→listings; KPI: listing CTR | Matrix: price × walkability |
| Itinerary | 3-day Boston itinerary for families | Itinerary module; CTA: route→activities/packages; KPI: assisted bookings | Timeline: day-by-day |
| Timing/price | best time to book flights to Vegas | Route insight module; CTA: route→flight search; KPI: search-to-book | Sparkline + fare calendar |
| Weekend planning | last-minute weekend getaways from NYC | Packages hub + curated lists; CTA: route→bundle CTA; KPI: attach rate | Card grid + drive-time map |
[Insert Image: Wireframe of "Day-by-Day Itinerary Widget" showing "Book This Day" CTA]
Caption: To capture AI citations, content must be structured as data-rich modules (left) rather than walls of text (right).
How to convert citations into bookings (the missing layer)
| Content module | Why LLMs cite it | Where it must link |
| “Best area to stay in [city]” blocks | comparative, decision-ready | neighborhood → listings |
| 2/3-day itineraries | structured, citable | activities → packages |
| “When to book flights to…” | data-led | route pages → search |
Citation-to-Booking Routing Ledger
| Cited template type | Failure mode | Fix | Measurement |
| Guides/itineraries | “dead end” pages | add “Plan & book” modules | assisted conversion |
| Destination hubs | too broad → bounce | add neighborhood shortcuts | hub→listing CTR |
| Flight insights | insight ≠ inventory | embed search modules | search start rate |
Disconfirming tests
• If citations rise but bookings do not: fix routing and CTAs on cited pages (citations are not the KPI).
• If ChatGPT citations behave differently than Perplexity: ship engine-specific templates and measure separately.
Site-Wide Booking Engine Projection (Organic → Booking)
Hypothetical Data for Illustration (US funnel ranges)
| Funnel step | Low | Mid | High |
| Organic visits → listings/PDP sessions | 8% | 12% | 18% |
| Listings/PDP → checkout start | 3% | 5% | 7% |
| Checkout start → booking | 25% | 35% | 45% |
| Scenario | Modeled bookings / month |
| Low | ~90,000 |
| Mid | ~315,000 |
| High | ~850,500 |
Practitioner Notes: Action Plan Roadmap (Prioritized by Profit)
Travel SEO Services Roadmap (P0/P1/P2)
| Priority | Workstream | Output | KPI | Profit linkage |
| P0 | Facet allowlist policy | index rules by template | winners rank ↑ | concentrate crawl + equity |
| P0 | Head-term push | “car rental” hub competitiveness | CTR ↑ | outsized CTR delta |
| P0 | Canonical governance | reduce cannibalization | rank stability ↑ | protect money pages |
| P1 | Hidden Asset scaling | all-inclusive trip-type expansion | bookings ↑ | margin-friendly cluster |
| P1 | AI citation program | itinerary + neighborhood modules | citations ↑ | assisted bookings |
| P2 | Locale governance | /es/ + hreflang audit | volatility ↓ | targeting clarity |
seo for travel website governance rules (non-negotiable)
• Index only demand-backed facets (allowlist + monitoring) to prevent combinatorial bloat.
• One canonical per intent (standardize canonicals) to reduce cannibalization and ranking volatility.
• Guides must route to inventory (guide -> listing/PDP pathways) to avoid TOFU dead ends.
Hidden Asset restated (required): scale the all-inclusive system, but only through controlled, demand-backed variants to avoid index dilution.
Final Reflection
Expedia’s US organic growth is ultimately architecture + trust + index discipline + conversion UX + AI readiness. Done well, that compounding system becomes a durable moat over 3–5 years—especially when the team treats Travel SEO Strategy as a profit function rather than a content calendar.
FAQs (Travel & SEO)
Are Travel SEO Services worth it for a large OTA like Expedia?
Yes—if they are implemented as template governance + conversion + measurable P&L modeling, not “publish more pages.”
What’s the best approach to SEO for travel website content without cannibalizing money pages?
Use guides for decision support (neighborhoods, itineraries, “when to book”), then route users into listings/PDPs via internal linking and demand-backed filters.
Which pages matter most for bookings: destination hubs, listings, or PDPs?
Listings and PDPs close revenue; destinations and guides win discovery. The job is making the path short and intent-consistent (especially on mobile).
How do you measure ROI for flights/hotels/packages SEO?
Use a CTR-aware model: rank → clicks → bookings → margin, then run sensitivity checks for ads, PAA, and AI Overview.
What is the core of Expedia SEO in the US market?
Owning high-intent templates (routes, destination filters, listings/PDP) while maintaining strict index discipline and high trust signals.
What should a modern Travel SEO Strategy include given AI answers?
A Travel SEO Strategy should include: (1) citable decision modules, (2) prompt-based citation measurement, and (3) booking-first routing on cited URLs.
Disclaimer
This teardown is based on publicly visible signals and the Ahrefs exports/snapshots you provided. Expedia is not our client, and we have not worked on Expedia SEO. All Modeled Example / Hypothetical Data tables are illustrative and should be validated against internal analytics, booking funnel metrics, and finance contribution margins.
- Log in to post comments

 INDIA
INDIA