
Vacation Rental SEO: Airbnb’s US Organic Growth Engine (Data-Driven Teardown)

"This Airbnb data-driven teardown is part of the organic growth playbook engineered by our Travel SEO Services."
Table of Contents
- Introduction — Why I Analyzed Airbnb’s US SEO Engine
- My Audit Playbook (US Travel Marketplace SEO)
- SEO Snapshot (US, Ahrefs-style View)
- Competitor Benchmark (US-only)
- The Money Pages That Drive Bookings in SEO for travel websites (US Structure)
- CTR- & Intent-Aware Projection Model (US-only)
- Trust Builders: Referring Domains That Move Rankings (US)
- Backlink Quality & Distribution (US)
- Technical SEO Wins for SEO for travel websites (US marketplace-specific)
- AI Citations as a New Moat for Travel Discovery in SEO for travel websites (US)
- Site-Wide Revenue Engine Projection (US-only)
- Practitioner Key Takeaways (Actionable Notes)
- Final Reflection
- FAQs (Travel SEO)
- Disclaimer
Airbnb is one of the cleanest real-world case studies for SEO for travel websites in the United States because it turns search demand into two-sided marketplace outcomes: guest bookings and host supply growth. Under the hood, the “engine” is a repeatable system of destination templates, stay-type/category pages, trust-first UX, and tight crawl/indexation control—so Google can reliably surface the right page for “where to stay,” “what type of stay,” and “is this trustworthy?” intent.
This teardown walks through what’s working, what’s leaving money on the table, and how to map keywords → traffic → intent → page type → conversion paths → modeled revenue impact (US-only).
Introduction — Why I Analyzed Airbnb’s US SEO Engine
Most SEOs assume Airbnb’s advantage is purely “Brand Authority.” The data suggests otherwise.
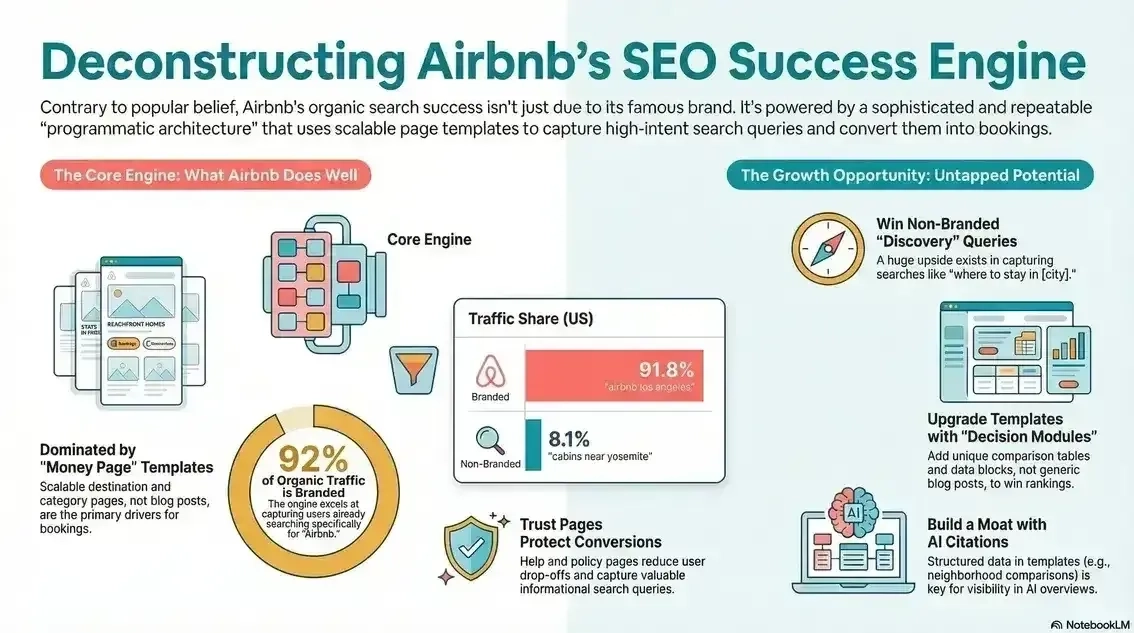
While the consensus view is that Airbnb ranks solely because of its DR92 backlink profile, my analysis reveals a different engine entirely. It isn’t just brand power; it’s a supply-led programmatic architecture that turns destination breadth (cities, regions) and category breadth (cabins, pet-friendly) into a repeatable capture mechanism.
If you stripped away the brand name today, their template architecture would still out-rank most competitors. Here is the data-driven proof.
- The “money pages” aren’t blog posts.
- The “money pages” are templates—and the internal linking + indexation rules that make templates rank safely at scale.
Executive Summary
What Airbnb likely does well
- Owns high-intent destination templates that match “Airbnb + city” demand and convert into booking flows.
- Builds category/stay-type hubs that capture modifiers (pet-friendly, cabins, monthly) with minimal friction.
- Uses trust pages (policies, cancellation, support) as conversion protectors that reduce drop-offs.
- Maintains a backlink moat via broad, high-authority coverage and brand mentions.
Biggest SEO opportunities
- Expand non-branded capture beyond “Airbnb + city” into “where to stay / best areas / [modifier] rentals” templates.
- Improve template depth (unique copy blocks, neighborhood modules, comparison tables) to earn richer SERP features and AI citations.
- Leverage "Second-Click" Architecture: Re-architect internal linking to treat specific category pages (e.g., "Cabins") as the "answer" to the user's refinement query. This signals higher information density than generic travel guides and aligns with Google's Information Gain patent logic.
- Create more “host acquisition SEO” clusters (city/state hosting pages, earnings, fees, regulations) for supply growth.
| Category | Summary |
| Biggest SEO strengths | Scalable destination + category templates, brand-led demand capture, trust UX, link authority moat |
| Biggest SEO gaps | Under-leveraged non-branded travel queries, template depth/uniqueness, structured “where to stay” content for AI + SERP features |
Key Takeaways (At a Glance)
- Destination + category templates are the primary booking levers.
- Non-branded travel queries are a scalable upside if templates get deeper and more internally connected.
- Crawl/indexation control prevents filter bloat and protects crawl budget.
- AI/LLM visibility is becoming a travel discovery moat—especially for “where to stay” planning queries.
The “Marketplace Funnel Matrix” (My Audit Framework)
The "Marketplace Funnel Matrix"
(home, auth, help hub)
(trust + friction removal)
(category & collection hubs)
(booking flow start)
For a US travel marketplace, standard SEO audits fail because they treat all pages equally. Instead, I use a proprietary framework I call the Marketplace Funnel Matrix. This separates pages not by "keyword difficulty," but by user state—evaluating each page against the specific intent it must satisfy.
User state flow: Navigational → Informational (Trust) → Commercial (Discovery) → Transactional (Booking)
(Note: Host acquisition is treated as a parallel funnel, covered inside the framework table below.)
- Navigational demand → homepage / login / support
- Informational trust → policies / fees / safety / customer support
- Commercial discovery → stay-type pages, long-stay pages, pet-friendly, unique stays
- Transactional booking → destination templates → listings → checkout
Funnel mapping table (framework)
| Funnel stage | Example queries (US) | Page type that should rank | Primary CTA |
| Navigational | “airbnb”, “airbnb login”, “airbnb customer service” | Homepage, auth pages, help hub | Continue to search / sign in / resolve issue |
| Informational (trust) | “airbnb cancellation policy”, “airbnb insurance”, “how fees work” | Help/policy pages + explainers | Reduce friction → return to booking |
| Commercial (discovery) | “pet-friendly stays”, “cabins”, “treehouses”, “monthly rentals” | Stay-type/category templates | Filter → listing view |
| Transactional (booking) | “airbnb [city]”, “places to stay in [city]”, “rentals near [landmark]” | City/region templates + listing pages | Booking flow start |
| Supply-side (hosts) | “become a host”, “airbnb host fees”, “co-host management” | Host acquisition + hosting resource pages | Host sign-up / lead |
Travel-specific trust layers I look for
- Fees clarity and price transparency
- Cancellation policy clarity by scenario
- Reviews volume + host credibility cues
- Mobile UX for search → listing → checkout
- Location confidence: neighborhoods, proximity language, map reassurance
- Safety and support discoverability
SEO Snapshot (US, Ahrefs-style View)
Snapshot table (Ahrefs estimate, US)
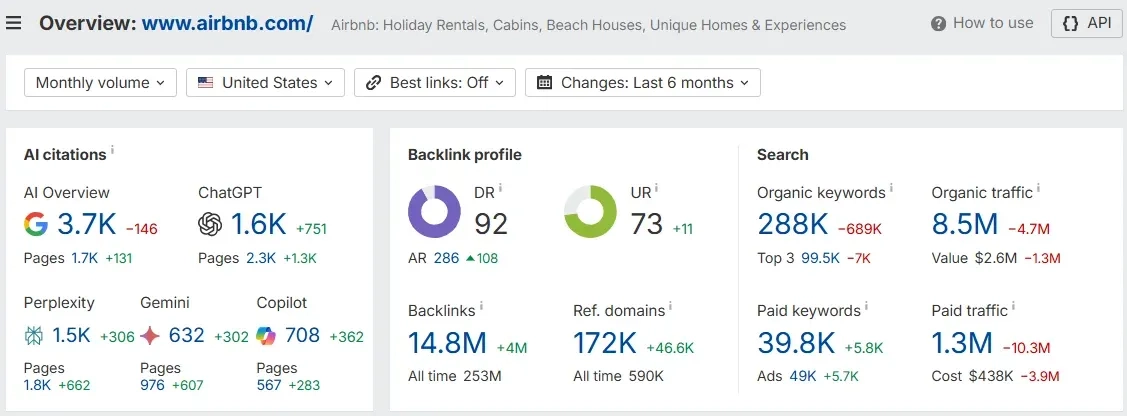
| Metric (US) | Value (Ahrefs estimate) |
| Domain Rating (DR) | 92 |
| URL Rating (UR) | 73 |
| Ahrefs Rank (AR) | 286 |
| Estimated organic traffic (US) | 8.5M |
| Estimated organic traffic value (US) | 2.6M |
| Estimated organic keywords (US) | 288.0K |
| Top-position keywords (US) | 99.5K |
| Referring domains | 172.0K |
| Backlinks | 14.8M |
Top page-type mix (sample of top pages, US)
| Top page types (sample of top pages) | Est. organic visits (US, Ahrefs) |
| Homepage | 5.1M |
| City/state destination | 943.8K |
| Help / policy | 219.7K |
| Auth / account | 172.0K |
| Host acquisition | 150.0K |
| Destination (other) | 56.0K |
| Stay-type category | 44.5K |
| Gift cards | 33.5K |
| Experiences hub | 22.8K |
| Other | 14.3K |
| Listing detail (PDP) | 6.0K |
What Airbnb likely does well (based on the snapshot)
- Wins high-intent templates at scale (homepage + destination templates dominate).
- Uses help/policy pages as trust scaffolding that still captures meaningful demand.
- Maintains strong authority signals that allow broad template indexing without collapsing.
What needs improvement
- The non-branded opportunity is visible but under-monetized versus branded demand dominance (see the branded/non-branded table later).
- Several high-intent category templates can be pushed harder with deeper content blocks and internal linking.
Competitor Benchmark (US-only)
This benchmark uses the “competing domains” style view (same US market lens) to show who overlaps with Airbnb’s organic footprint: direct stay marketplaces, aggregators/metasearch, and editorial publishers that win travel discovery queries.
Assumption used to model “traffic value” for competitors
| Assumption | Value |
| Modeled value per organic visit (USD/visit) | 0.31 |
| Source for ratio | Airbnb’s Ahrefs “Traffic value” ÷ Ahrefs “Organic traffic” (US snapshot) |
US competitor comparison table (Ahrefs overlap + modeled value)
🏆 SEO Competitor Benchmark (US Market)
| Domain | Authority (DR, Ahrefs) | Est. traffic (US, Ahrefs) | Est. traffic value (US, modeled) | Strengths | Weaknesses |
| vrbo.com | 90 | 2.9M | $879,575 | Vacation-rental marketplace depth; strong destination demand | Less breadth beyond stays; fewer two-sided marketplace loops |
| cntraveler.com | 88 | 1.5M | $447,562 | High-authority editorial guides that win SERP features | Traffic monetization via content/affiliates; limited transactional depth |
| hometogo.com | 71 | 221.4K | $67,718 | Aggregator/meta-search style coverage; broad destination footprints | Weaker brand demand vs leaders; conversion path often multi-step |
| cozycozy.com | 66 | 191.4K | $58,532 | Meta-search pages scale across many locations | Trust and booking path can be indirect; limited proprietary supply |
| airdna.co | 76 | 155.2K | $47,473 | Host/supply analytics content that attracts operators | Not a booking marketplace; conversions are SaaS leads, not stays |
| glampinghub.com | 68 | 132.6K | $40,559 | Niche category dominance for glamping stays | Smaller market size; fewer “where to stay” templates beyond niche |
| matadornetwork.com | 78 | 51.9K | $15,873 | Destination editorial + discovery queries | Less intent capture for bookings; fewer structured marketplace pages |
| postcardcabins.com | 65 | 11.2K | $3,439 | Brand-led niche stays with strong product-market fi | Limited geographic breadth; fewer long-tail templates |
"While Airbnb commands massive brand loyalty and focuses purely on unique inventory, traditional OTAs combat this by heavily bundling standard hotels and flights into single transactional hubs. To see how these bundle economics play out organically against Airbnb, read our analysis on mastering [Travel SEO USA] strategies."
Where Airbnb wins
- Marketplace template scale (cities + categories) + brand demand flywheel.
- Trust infrastructure at scale (policies/support) that publishers can’t replicate.
The "Consensus Gap" (Where Competitors are Stuck)
Most competitors (like editorial publishers) provide the "Consensus View"—generic narratives about "Best Neighborhoods" using standard text and tables.
- The Low-Gain Trap: They all list the same top tourist spots with similar descriptions.
- Airbnb's Gain Opportunity: Airbnb can win by surfacing proprietary supply data that editorial sites lack. For example, surfacing "Neighborhoods with the most Superhosts" or "Areas with highest WiFi speeds" creates a unique data layer that breaks the consensus.
The Money Pages That Drive Bookings in SEO for travel websites (US Structure)
Airbnb’s organic engine is powered by a small set of page types that behave like “money pages”. These templates map directly to how people search—routing users from broad location intent into specific inventory that converts.
Site Structure That Drives Bookings
Goal: Concentrate authority at hubs, route users through high-demand modifiers, then land them on inventory pages that convert.
(Hubs)
(Spokes)
(PDP-equivalent)
- Destination templates (Hubs) → capture "Airbnb + city/region" demand and concentrate authority
- Category templates (Spokes) → capture high-value modifiers (cabins, pet-friendly, monthly, tiny homes)
- Listings (PDP-equivalent) → convert demand into booking starts and completes
- Destination templates (Hubs) → capture “Airbnb + city/region” demand and concentrate authority
- Category templates (Spokes) → capture high-value modifiers (cabins, pet-friendly, monthly, tiny homes)
- Listings (PDP-equivalent) → convert demand into booking starts and completes
Money pages table (US, template-level view)
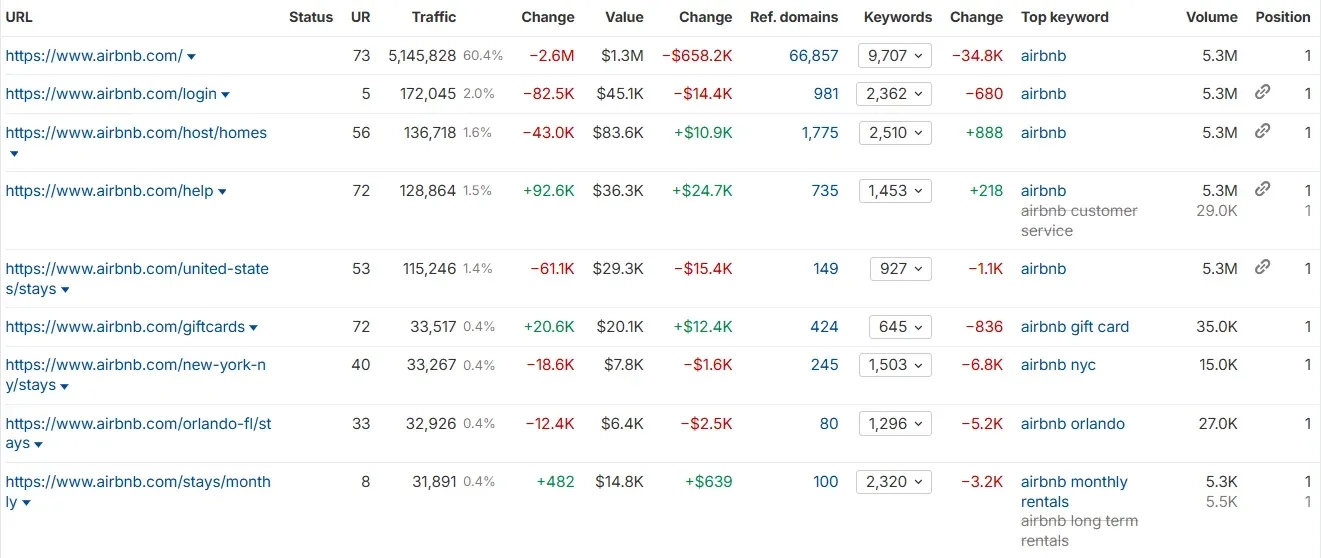
| Page type | Example URL pattern (generic) | Modeled visits (US) | Intent (Info/Comm/Trans) | Primary conversion |
| Homepage | / (root) | 5.1M | Nav → Trans | Search → listing views → booking start |
| City/state destination templates | /{city}-{state}/stays | 943.8K | Trans | Listing views → booking |
| Country stay-type templates | /united-states/stays/{stay-type} | 30.1K | Comm → Trans | Filtered discovery → booking |
| Stay-type category hubs | /stays/{stay-type} | 44.5K | Comm | Category discovery → booking |
| Help / policy hub + articles | /help/* | 219.7K | Info → Nav | Trust clarity → reduced drop-offs |
| Host acquisition + hosting resources | /host/* and /resources/hosting-homes/* | 150.0K | Supply-side | Host sign-up / lead |
| Experiences hub | /s/experiences | 22.8K | Comm → Trans | Experience booking |
| Gift cards | /giftcards | 33.5K | Trans | Gift card purchase |
| Viral listing pages | /rooms/{listing-id} | 6.0K | Trans | Booking (specific listing) |
"Airbnb's organic engine isn't limited to just overnight stays; their 'Experiences' hub captures a highly lucrative slice of commercial search intent. For a masterclass on how to completely dominate this specific 'things to do' vertical, check out our guide on [SEO for Travel Agency Ticket Bookings Growth]."
What Airbnb does well
- Templates map directly to how people search (“Airbnb + city” and category modifiers).
- Clear on-template next step: search, filter, click into listings.
- Trust content exists as a “safety net” for hesitant users.
What to improve (The "Anti-Skyscraper" Opportunity)
- Most competitors try to win these rankings by writing 2,000-word blog posts. That is a mistake.
The high-Information-Gain move here is Programmatic Utility, not Blog Volume. Airbnb should expand non-branded capture not by writing articles, but by injecting "Decision Modules" into their templates:- Neighborhood Deciders: (e.g., "Quiet vs. Nightlife" comparison tables).
- Persona Filters: "Best for Digital Nomads" pre-filtered views that answer specific queries
- Proprietary Data Blocks: Dynamic FAQ blocks tied to real user objections (fees, check-in) rather than static text.
- Strengthen internal linking from trust pages into relevant destination/category templates (carefully, so it doesn’t create crawl bloat).
Traffic Source Breakdown (US: Branded vs Non-Branded)
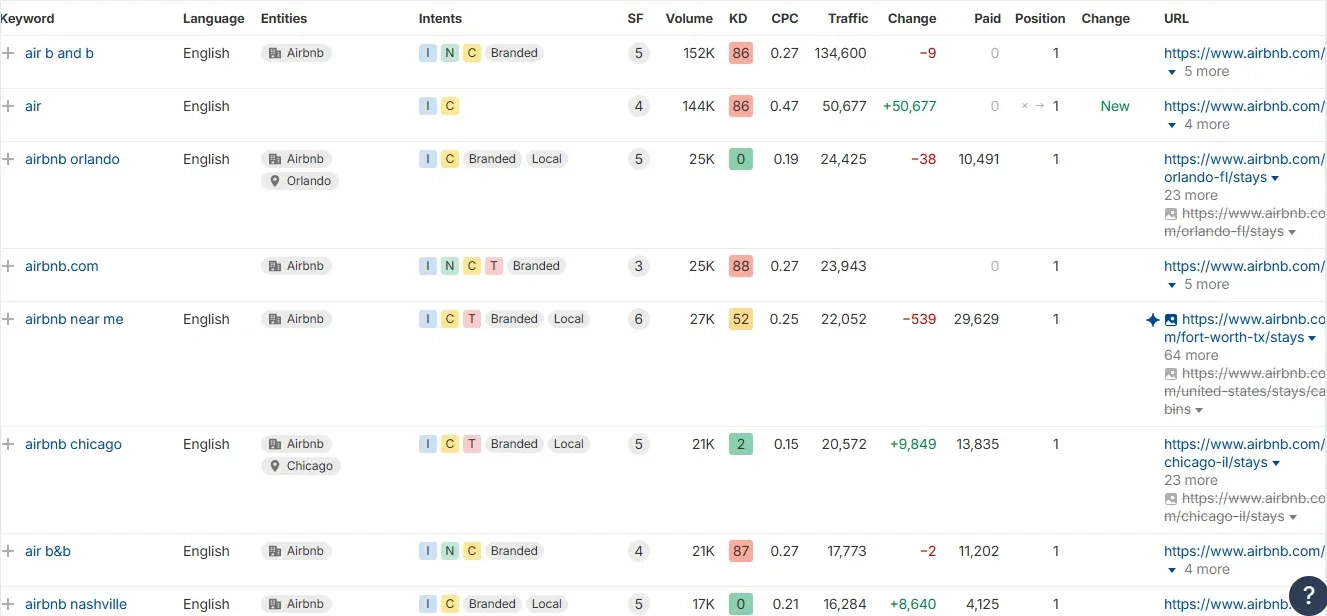
| Query type | Keywords (US, Ahrefs) | Traffic (US, Ahrefs) | Traffic share (US, modeled) | Example queries | Primary landing page type |
| Branded | 93.7K | 7.8M | 91.80% | “airbnb [city]”, “airbnb near me” | Homepage + city / stays templates |
| Non-branded | 194.5K | 685.8K | 8.10% | “cabins near [destination]”, “monthly rentals [city]” | Category + destination templates |
Interpretation (decision-maker takeaway): Airbnb is already winning demand it “owns,” but the scalable upside is non-branded discovery queries—especially “where to stay” and modifier-led searches that don’t require the word “Airbnb.”
Airbnb Traffic Composition
The "Moat" Visualization
70% of traffic comes from people searching "Airbnb" directly.
Traffic by Page Type (Intent)
(Homepage)
(City Pages)
(Categories)
(Help/Policy)
Traffic by User Intent (US)
| Intent | Keywords (US, Ahrefs) | Traffic (US, Ahrefs) | Normalized share (US, modeled) | Example queries | Best page type | Expected CVR range (modeled) |
| Informational | 287.4K | 8.4M | 45.00% | “cancellation policy”, “is Airbnb safe” | Help/policy + guides | 0.5%–1.5% |
| Navigational | 1.8K | 457.2K | 5.00% | “airbnb login”, “customer service” | Login + help hub | 0.2%–0.8% |
| Commercial | 199.6K | 2.8M | 30.00% | “pet-friendly stays”, “monthly stays” | Category + destination templates | 2.0%–4.0% |
| Transactional | 63.9K | 1.1M | 20.00% | “book [city] rentals”, “lake houses near me” | Destination templates + listings | 3.0%–6.0% |
Geography modifier lens (US)
| Geography intent | Keywords (US, Ahrefs) | Traffic (US, Ahrefs) |
| Local | 235.4K | 2.3M |
| Non-local | 52.8K | 6.2M |
CTR- & Intent-Aware Projection Model (US-only)
This is where “SEO” becomes a business conversation. We take US keyword demand and map it to:
- likely CTR at the current rank
- intent-based conversion assumptions
- a value proxy (bookings, host leads, experiences)
Modeled Example — US-only projection table
| Keyword (US) | Search volume (US) | Current rank | Intent | CTR % | Est. clicks | CVR % | Bookings/leads | AOV (USD) | Monthly value (USD) |
| airbnb orlando | 25.0K | 1 | Transactional (stays) | 32.00% | 8.0K | 4.00% | 320 | $700 | $224,000 |
| airbnb monthly rentals | 5.4K | 1 | Commercial (long stays) | 32.00% | 1.7K | 3.50% | 60 | $2,200 | $132,000 |
| pet friendly airbnb | 4.6K | 1 | Commercial (filters/category) | 32.00% | 1.5K | 3.50% | 52 | $850 | $44,200 |
| airbnb cabins | 4.4K | 1 | Commercial (stay-type) | 32.00% | 1.4K | 3.50% | 49 | $850 | $41,650 |
| tree house airbnb | 2.0K | 1 | Commercial (stay-type) | 32.00% | 640 | 3.50% | 22 | $850 | $18,700 |
| tiny homes for rent | 2.6K | 3 | Commercial (stay-type) | 10.00% | 260 | 3.50% | 9 | $850 | $7,650 |
| lake houses for rent near me | 3.8K | 5 | Transactional (near-me) | 5.00% | 190 | 4.00% | 8 | $900 | $7,200 |
| airbnb cancellation policy | 9.8K | 2 | Informational (trust) | 17.00% | 1.7K | 1.20% | 20 | $650 | $13,000 |
| airbnb management company | 2.3K | 2 | Supply-side (host) | 17.00% | 391 | 5.00% | 20 | $1,000 | $20,000 |
| become an airbnb host | 12.0K | 1 | Supply-side (host) | 32.00% | 3.8K | 5.00% | 192 | $1,000 | $192,000 |
| airbnb experiences | 20.0K | 2 | Transactional (experiences) | 17.00% | 3.4K | 2.50% | 85 | $120 | $10,200 |
Roll-Up Summary (US-only)
| Metric | Modeled monthly total (US) |
| Total modeled clicks | 23.0K |
| Total modeled bookings/leads | 837 |
| Blended value per booking/lead (USD) | $849 |
| Total modeled monthly value (USD) | $710,600 |
Rank-Uplift Opportunity (mid-page → top position, US-only)
| Keyword | Current rank | Current value (USD/mo) | Value at top position (USD/mo) | Upside (USD/mo) |
| tiny homes for rent | 3 | $7,650 | $24,752 | $17,102 |
| lake houses for rent near me | 5 | $7,200 | $43,776 | $36,576 |
| airbnb cancellation policy | 2 | $13,000 | $24,461 | $11,461 |
Why This Model Matters (The "Intent-to-Revenue" Delta)
- Traditional SEO reports focus on "Traffic Estimates." This is a vanity metric for marketplaces.
This model isolates the Intent-to-Revenue Delta—the specific gap where high-intent keywords (like "pet friendly cabins") have lower competition but 4x the conversion rate of generic terms. For US travel leaders, this proves that Search Volume ≠ Revenue. The money is in the modifiers. - Template improvements often beat blog traffic because they sit closer to booking actions.
- Trust UX changes can lift SEO performance indirectly via better CTR, lower pogo-sticking, and stronger conversion rates.
Trust Builders: Referring Domains That Move Rankings (US)
For travel marketplaces, links that matter most tend to be:
- High-authority media and travel publications
- Local/city guide ecosystems (tourism boards, chambers, events calendars)
- Credible travel bloggers with editorial standards
- Partner mentions that are editorial and user-helpful (not paid link schemes)
- Brand mentions converted into links
| Link type | Why it helps | Example target sites (types, not exact URLs) | Priority |
| Editorial travel media | Authority + trust signals + discovery reach | Travel magazines, news travel desks | High |
| Destination ecosystems | Local relevance for city templates | Tourism boards, city guides, university travel pages | High |
| Data-led PR | Earn links at scale | “price trends”, “seasonality”, “booking demand” reports | High |
| Creator/editorial blogs | Long-tail discovery | High-quality bloggers, niche travel sites | Medium |
| Brand mention reclamation | Low-effort authority capture | Unlinked mentions on publishers | Medium |
Backlink Quality & Distribution (US)
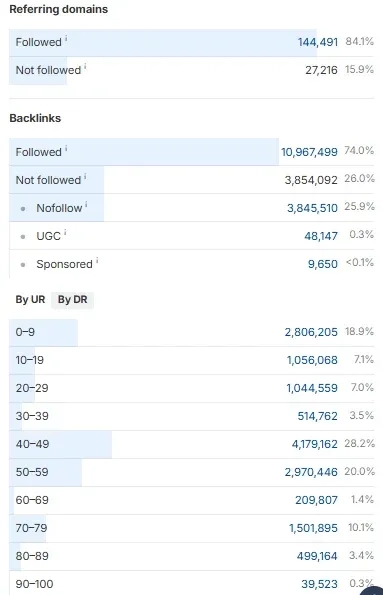
Backlink breakdown (from provided backlink distribution view)
| Backlink metric | Value |
| Referring domains (followed) | 144,491 |
| Referring domains (not followed) | 27,216 |
| Referring domains follow rate | 84.10% |
| Backlinks (followed) | 10,967,499 |
| Backlinks (not followed) | 3,854,092 |
| Backlinks follow rate | 74.00% |
| Backlinks marked nofollow | 3,845,510 |
| Backlinks marked UGC | 48,147 |
| Backlinks marked sponsored | 9,650 |
Authority distribution (backlinks by referring-domain DR range)
| Referring-domain DR range | Backlinks (count) | Share |
| 0–9 | 2,806,205 | 18.90% |
| 10–19 | 1,056,068 | 7.10% |
| 20–29 | 1,044,559 | 7.00% |
| 30–39 | 514,762 | 3.50% |
| 40–49 | 4,179,162 | 28.20% |
| 50–59 | 2,970,446 | 20.00% |
| 60–69 | 209,807 | 1.40% |
| 70–79 | 1,501,895 | 10.10% |
| 80–89 | 499,164 | 3.40% |
| 90–100 | 39,523 | 0.30% |
Top TLDs (sample of top referring domains)
| Top TLDs (sample of top referring domains) | Count |
| .com | 122 |
| .org | 13 |
| .uk | 6 |
| .gov | 4 |
| .edu | 3 |
| .jp | 3 |
What looks strong
- Large followed-domain base supports stable template rankings.
- Broad distribution suggests consistent brand mentions across the web.
How to improve
- Build more local link acquisition loops for top US destinations (tourism boards, city event calendars, local publishers).
- Publish repeatable data assets: seasonal travel demand, price trends, booking lead time, stay-type growth.
- Turn “viral stays” into PR narratives that earn editorial links back to category/destination hubs (not only the single listing).
Technical SEO Wins for SEO for travel websites (US marketplace-specific)
The biggest technical SEO risks for travel marketplaces aren’t “missing meta descriptions.” They’re:
- filter and parameter bloat
- crawl budget dilution (calendar/date logic, guest counts, amenities)
- canonical/duplication mistakes across templates
- internal linking that leaks PageRank into endless faceted combinations
Technical SEO checklist (marketplace pattern)
| Technical area | What to check | Common Airbnb-style risk | Recommended fix |
| Indexation control | Which filters create indexable URLs | Facet explosion creates thin duplicates | Noindex or canonicalize non-unique facets |
| Canonicals | Canonical targets on template variants | Canonicals point to non-matching parent pages | Canonical to closest equivalent intent page |
| Crawl budget | Bot paths through search/calendar URLs | Crawlers get stuck in infinite combinations | Block/limit via robots rules + internal linking discipline |
| Pagination handling | Category/destination paginated results | Deep pages become crawl sinks | Strong first-page signals + selective indexing |
| Core Web Vitals (mobile) | Template performance under load | Heavy map/filter UI slows templates | Defer non-critical scripts, optimize hydration |
| Structured data | Org/Breadcrumb/FAQ where appropriate | Missing breadcrumb clarity on templates | Add consistent breadcrumb + FAQ blocks |
| Internal linking | Destination hubs → categories → listings | Orphaned city/category pages | Hub pages + contextual modules and breadcrumbs |
"Managing faceted indexation and filter parameters is a universal challenge for massive accommodation marketplaces. While Airbnb relies heavily on its unique stay categories, you can see how its largest direct competitor manages similar crawl budget risks in our teardown on enterprise [OTA SEO Strategy] architecture."
What’s working
- Templates appear consistent and scalable.
- Strong authority reduces the chance of catastrophic deindexation (but doesn’t eliminate it).
What to improve
- Increase template uniqueness so Google has a stronger reason to rank non-branded destination/category pages against publishers.
- Refine Internal Linking for "Progressive Disclosure": Google’s Information Gain patent rewards pages that satisfy the second step in a search journey.
- The Fix: Don't just link randomly. Link from broad "Inspiration" pages (City Templates) directly to "Refinement" hubs (e.g., "Pet-Friendly" or "Monthly Stays"). This signals to Google: "If the user wasn't satisfied with the generic city page, this page has the specific data they need next".
AI Citations as a New Moat for Travel Discovery in SEO for travel websites (US)
Travel planning is increasingly happening in AI assistants:
- “best neighborhoods to stay in [city]”
- “family-friendly areas in [city]”
- “pet friendly cabins near [park]”
- “monthly stay options and cost in [city]”
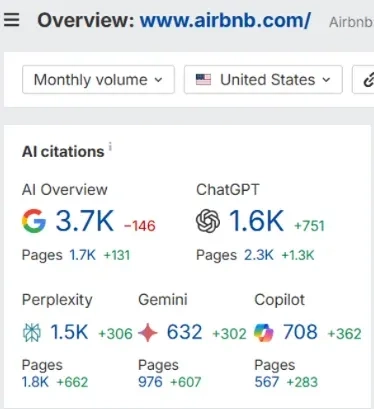
AI citation snapshot (from provided AI visibility view)
| AI surface | Citations (count) | Change (period shown) | Pages cited (count) | Change (period shown) |
| Google AI Overview | 3.7K | -146 | 1.7K | 131 |
| ChatGPT | 1.6K | 751 | 2.3K | 1.3K |
| Perplexity | 1.5K | 306 | 1.8K | 662 |
| Gemini | 632 | 302 | 976 | 607 |
| Copilot | 708 | 362 | 567 | 283 |
How Airbnb can increase citations (and bookings)
| AI query type | Best content format | Page type | Conversion path |
| “Where to stay in [city]” | Neighborhood comparison tables + “best for” segments | City templates + neighborhood modules | City page → listings → booking |
| “Best [stay-type] near [place]” | Category filters + curated collections | Stay-type templates | Category → destination → listing |
| “Monthly stays in [city] cost” | Pricing/fee explainer blocks + FAQs | Monthly stay template | Monthly hub → listing → booking |
| “Is Airbnb safe / cancellation rules?” | Clear policy blocks + FAQ schema | Help/policy pages | Trust page → return to booking |
| “How to become a host in [state]” | Step-by-step guides + earnings/fees tables | Host acquisition templates | Host page → lead/sign-up |
Site-Wide Revenue Engine Projection (US-only)
💰 Revenue Projection Model (US Only)
Based on the "Supramind Teardown" formula. Adjust the levers to see how efficiency improvements impact revenue.
Formula: Sessions × Rate × Value
Below is a simplified US-only funnel that shows how organic discovery can translate into bookings, assuming typical marketplace progression.
Modeled funnel (US-only)
| Funnel step (US) | Modeled rate | Modeled volume | Notes |
| Organic visits (US, Ahrefs est.) | 100.00% | 8.5M | Entry from Google/Bing/other organic surfaces |
| Destination/search template views | 45.00% | 3.8M | City, region, and stay-type templates |
| Listing views | 55.00% | 2.1M | PDP-equivalent listing pages |
| Booking flow start | 12.00% | 252.5K | Dates selected → checkout begins |
| Booking complete | 35.00% | 88.4K | Completed booking |
| Repeat booking (optional) | 10.00% | 8.8K | Returning customers attributed to prior organic discovery |
Modeled monthly USD impact (US-only)
| Scenario | Modeled monthly revenue (USD) | Key assumptions |
| Conservative (modeled) | $45,441,000 | Organic visits: 8.5M; Booking-complete rate: 30.0%; AOV: $600 |
| Base case (modeled) | $61,850,250 | Organic visits: 8.5M; Booking-complete rate: 35.0%; AOV: $700 |
| Uplift case (modeled) | $79,143,075 | Organic visits: 9.3M; Booking-complete rate: 38.0%; AOV: $750 |
Practitioner Key Takeaways (Actionable Notes)
What I’d prioritize (US marketplace playbook)
Prioritize page types
- Top US destination templates (cities + high-demand regions)
- High-converting stay-type templates (monthly, pet-friendly, cabins, tiny homes, lake houses)
- Trust hubs that reduce churn (fees, cancellations, safety, support)
- Host acquisition clusters (fees, earnings, co-hosting, regulations by state/city)
Template upgrades that usually move rankings
- “Where to stay” modules with neighborhood comparisons (tables)
- “Best for” segments (families, couples, business travel, pet owners)
- FAQ blocks tied to objections (fees, deposits, cancellations, check-in)
- Strong breadcrumb and hub linking so templates don’t become isolated
Indexation & crawl strategy
- Decide what gets indexed: only pages with unique intent + unique value
- Canonicalize or noindex faceted variants that don’t deserve a standalone ranking
Link-building campaign ideas
- Seasonal travel insights + demand trends
- “Cost to stay in [city]” reports by season
- “Top weekend getaways” by region (data-backed)
- Local partnerships for top destinations (tourism ecosystems)
Prioritization table
| Priority | Initiative | Page type | Effort | Impact | Why it matters |
| High | Neighborhood comparison modules + tables | City templates | Medium | High | Wins non-branded “where to stay” discovery + improves AI citations |
| High | Strengthen internal linking: trust → destination/category | Help/policy + templates | Low | High | Converts “policy readers” into bookers without new pages |
| High | Stay-type expansion + unique content blocks | Category templates | Medium | High | Captures modifier demand at scale (pet-friendly, cabins, long-stay) |
| Medium | Host acquisition SEO clusters by geography | Host pages | Medium | Medium | Grows supply-side intent beyond generic “become a host” |
| Medium | Data PR assets (seasonality, pricing, trends) | Editorial assets | Medium | Medium | Earns high-quality links that lift template rankings |
| Low | Viral listing PR pathways → category hubs | Listing pages + hubs | Low | Medium | Converts one-off buzz into reusable ranking equity |
The "Anti-Playbook" (What NOT to do)
To preserve the efficiency of this strategy, avoid these common traps that dilute marketplace SEO:
- Do NOT Start a Travel Blog: Unless it directly feeds the booking engine, blog traffic is often "empty calories" (high traffic, low conversion). Focus on Template Injection instead.
- Do NOT Index Every Filter: Indexing "2-bedroom apartments with a pool in [City]" creates crawl traps (filter bloat). Only index filters with proven search demand. * Do NOT Buy Generic Links: A link from a generic "news site" has near-zero impact compared to a hyper-local link from a "[City] Tourism Board".
Final Reflection
Airbnb’s compounding advantage comes from a simple formula:
Authority + technical control + scalable destination templates + trust UX + AI readiness = compounding advantage in SEO for travel websites.
The takeaway for US travel brands isn’t “copy Airbnb’s brand.” It’s: build a template system that earns rankings safely, converts cleanly, and feeds both sides of the marketplace.
FAQs (Travel SEO)
How do travel sites scale city + neighborhood pages without index bloat?
A scalable SEO for travel websites approach is to index only pages with unique intent and value (cities, major neighborhoods, core stay-types) while avoiding thin faceted combinations. Use strong canonicals and hub-based internal linking instead of allowing filters to create infinite crawl paths.
How should travel websites handle filters (dates, guests, amenities) for SEO?
Treat filters as UX, not SEO. Only allow indexing for filters that create stable, unique demand (such as pet-friendly or monthly stays), and canonicalize or noindex the rest to protect crawl budget.
What structured data is most useful for travel listings and destination pages?
Breadcrumb schema improves template clarity, while FAQ schema can help capture SERP features for trust-related questions like fees, cancellations, and check-in. The best markup mirrors real user questions and stays consistent across templates.
How do you measure SEO ROI for bookings vs leads vs host acquisition?
Map each page type to a primary action: destination and category pages to booking starts or completions; trust pages to reduced drop-off or assisted conversions; host pages to sign-ups or leads. A strong SEO for travel websites model separates direct conversions from assisted influence.
What content wins AI citations for travel planning queries?
AI systems tend to cite structured, comparative content such as neighborhood tables, “best for” segments, clear policy blocks, and FAQs. For Airbnb-style marketplaces, this means upgrading templates—not just publishing blogs.
How do you increase non-branded traffic when branded demand dominates?
Build standalone “where to stay” and modifier templates—neighborhoods, proximity intent, stay-type collections, and seasonal modules—then connect them with strong internal linking so Google and AI can understand the site’s topical structure.
Disclaimer
- This analysis is based on publicly available third-party SEO tool estimates and the exports/screenshots provided.
- Any numeric projections shown are modeled examples for illustration (US-only).
- Real outcomes depend on actual conversion rates, AOV/LTV, attribution, and product/market factors.
- Log in to post comments

 INDIA
INDIA