
OTA SEO Strategy: Booking.com Teardown to Win More Organic Hotel Bookings

"This Booking.com teardown is a key piece of Supramind’s strategic hub on maximizing SEO for Travel Website performance."
Table Of Content
- Introduction
- Executive summary (TL;DR)
- Key takeaways (at-a-glance)
- My Audit Playbook for Booking.com SEO (US)
- SEO Snapshot (Hypothetical Ahrefs-Style View)
- Competitor benchmark — US Travel SERP Reality
- The Money Pages That Drive Bookings
- Branded vs Non-Branded Breakdown (US)
- Traffic by User Intent (Overlapping)
- CTR- & Intent-Aware Projection Model (Travel SEO Strategy)
- Trust Builders: Referring Domains That Move Rankings in Travel
- Backlink Quality & Distribution
- Technical SEO & Indexation Control for OTAs
- AI Citations as a New Moat for Booking.com SEO
- Site-Wide Booking Engine Projection (Organic → Booking)
- Practitioner Key Takeaways (Actionable Notes)
- Final reflection
- FAQs (Travel & SEO)
- Disclaimer
Introduction
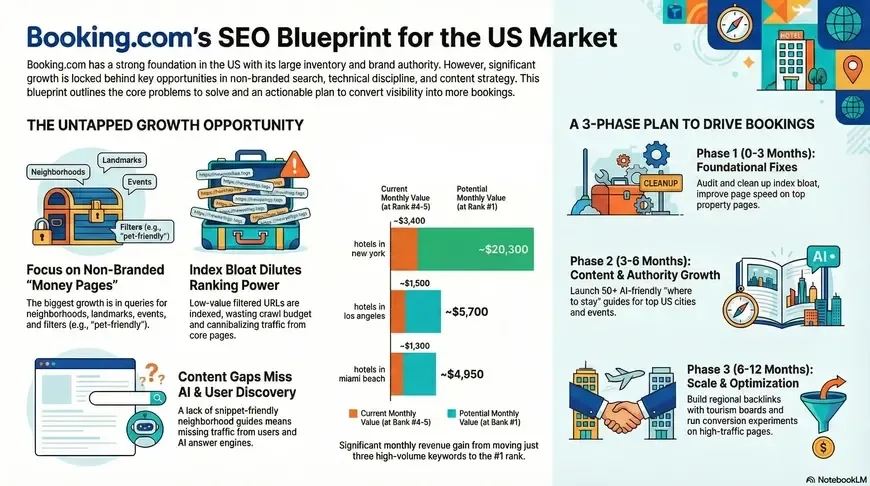
Why this audit? I analyzed Booking.com because it’s an ideal case for SEO for Travel Website work: huge inventory, strong brand, and product complexity make the site a great place to study how organic search can be converted into revenue. In my experience, city + hotel discovery in the US is among the hardest SEO problems — Google’s travel modules, maps, hotel chains, and OTAs all compete for the same high-intent queries. The long tail (neighborhoods, landmarks, events, and filters like “free cancellation” or “pet-friendly”) is where the margins live, and my goal here is to show exactly how Booking.com can turn that long tail into bookings.
This teardown answers one practical question: How do we turn US organic visibility into materially more hotel / rental / category bookings and revenue? I’ll walk through architecture, index discipline, content, backlinks, LLM readiness, and conversion — then show a CTR-aware projection for the top 10 US keywords so you can see the math.
Executive summary (TL;DR)
- What Booking.com does well (US lens): I found exceptional brand strength, very broad inventory, and a very large backlink/LLM footprint. Branded demand and many city transactional SERPs are already in place.
- Biggest opportunities: I see the clearest upside in non-branded destination + filter queries (neighborhoods, events, “pet-friendly”), index control for faceted pages, LLM/snippet work on “where to stay” guides, and CTR/conversion gains on property pages.
- Structural advantage: Property pages with price and availability are conversion engines — my team treats these as our highest-value assets.
- Tactical gaps: In my experience, index bloat from faceted navigation, insufficient neighborhood/event content that LLMs prefer, and uneven US regional links are the main tactical failures.
- Strategic conclusion: A practical Travel SEO Strategy for Booking.com in the US is architecture → index discipline → CTR → conversion → AI readiness. That sequence converts rank gains into bookings predictably.
Key takeaways (at-a-glance)
- Money pages (city listings, neighborhood/landmark pages, property pages, deals) are the primary booking drivers.
- Non-branded destination + filter queries are the growth lever beyond brand.
- The highest ROI is improving CTR and rank for top commercial keywords (move #3–#5 → #1–#2).
- Indexation discipline (noindex low-value facets) is a high-leverage technical multiplier.
- AI/LLM citations are an early moat — structured guides and crisp policy blocks will be cited and funnel discovery clicks.
Audit Playbook for Booking.com SEO (US)
I approach Booking.com like a marketplace problem: it’s not just SEO — it’s product, indexing, and conversion working together.
Framework (OTA-specific)
- I use keyword & position data, backlink audits, a crawl/index report, Core Web Vitals, and LLM citation checks.
- I map the funnel as Navigational → Informational → Commercial → Transactional, and map each page type to those stages.
- I evaluate marketplace trust (reviews, policy clarity, safety, support) because these signals both influence Google and directly affect conversion.
US specifics that matter
- Mobile-first behavior, heavy “near me” and same-weekend demand, road trips, and event-driven spikes. Filters like “free cancellation,” “parking,” and “pet friendly” matter more in the US than in many other markets.
- My team prioritizes city/neighborhood/landmark pages and seasonal/event pages because they directly map to the search patterns we see for US travelers.
What I focus on in audits
- Index/control of faceted navigation (this is the single biggest technical risk for OTAs).
- Neighborhood guides and event landing pages that feed money pages without cannibalizing them.
- Conversion friction on property pages (speed, pricing clarity, cancellations, payment UX).
- Earning US regional authority links (CVBs, regional publishers, event organizers).
SEO Snapshot (Hypothetical Ahrefs-Style View)
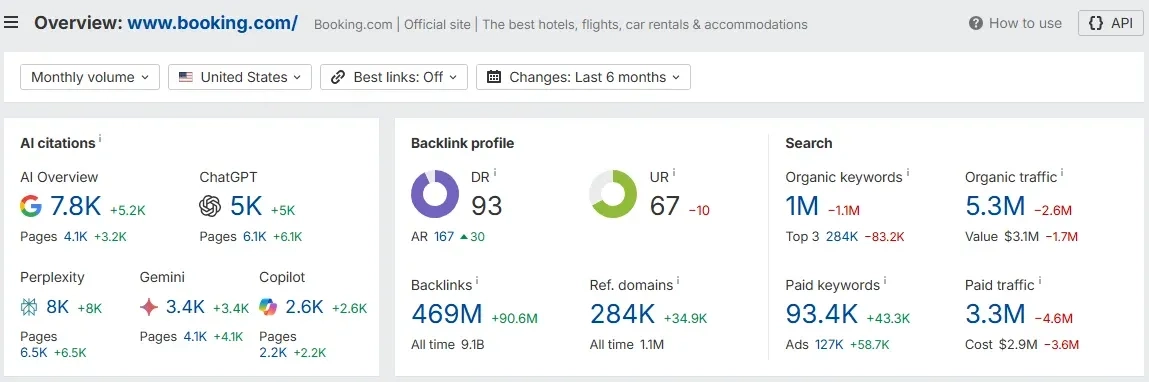
Modeled / Observed baseline (US-only) — this is drawn from the Ahrefs-style snapshot in your audit materials and is labelled accordingly.
| Metric | Value (US) | Note |
| Organic traffic (US) | ~5.3M / mo | Observed snapshot (US lens) |
| Organic keywords (US) | ~1M | Large long-tail presence |
| Referring domains | ~284K | Very strong link base |
| Backlinks | ~469M | Mix of followed / nofollow |
| Domain Rating (DR) | 93 | Very authoritative |
| UR (site strength) | 67 | Property-level variance |
| Branded vs Non-branded | Branded ~ 3.3M / Non-branded ~ 2.0M | Observed traffic split |
| LLM / AI citations | Google 7.8K / ChatGPT 5K / Perplexity 8K / Gemini 3.4K | Booking.com already appears in LLM outputs |
What this snapshot tells me
- Booking.com has the infrastructure and brand to win more — the problem isn’t supply, it’s signal discipline and conversion refinement. The link profile is huge, but my team would repurpose link efforts toward US regional authority to lift neighborhood & event pages.
Competitor benchmark — US Travel SERP Reality
US Travel Competitor Benchmark
Domain Rating (DR) vs. Estimated Organic Traffic
Opportunity: Neighborhood guides & links.
Strategy: Neighborhood + Event pages.
Win: LLM-friendly local guides.
I benchmark Booking.com against multiple competitor surfaces: Expedia/Hotels.com, Tripadvisor, Airbnb/Vrbo, Priceline/Agoda, major hotel chains, and Google Travel. The table below is a modeled, high-level view.
| Domain | Modeled DR | Est. Organic Traffic (US/mo) | Observed Strengths | Where Booking.com can win |
| Booking.com | 93 | 5.3M | Inventory scale, property UX | Index discipline, neighborhood guides |
| Expedia.com | 91 | 3.8M | Hotel + flight combos, content hubs | LLM-friendly local guides |
| Hotels.com | 85 | 1.6M | Hotel loyalty UX | Price/availability snippets |
| Tripadvisor.com | 92 | 2.9M | UGC, local guides | Convert guides into bookings |
| Airbnb.com | 92 | 4.1M | Rentals authority | Neighborhood + event pages |
| Marriott.com | 80 | 0.9M | Brand loyalty | Price comparators, chain benefits |
| Google Travel | n/a | n/a | SERP-level competitor surface | Win SERP features (price/review snippets) |
"While Booking.com heavily relies on its sheer inventory scale to win organic clicks, its biggest rival takes a slightly different approach by aggressively bundling flights and hotels into unified content hubs. To see exactly how that bundle strategy plays out in the search results, take a look at our complete guide on dominating [Travel SEO USA]."
My read: Competitors often win on UGC/local guides (Tripadvisor) or content hubs and SERP features (Expedia). Booking.com’s edge is inventory and trust; my recommendation is to marry that edge to better discovery content and regional link signals.
"While Booking.com and Tripadvisor battle over hotel and general travel intent, the 'tours and activities' vertical operates on its own unique search dynamics. We break down exactly how to dominate this specific niche to drive experience-based revenue in our guide on [SEO for OTA Ticket Bookings Growth]."
The Money Pages That Drive Bookings
I view the site as a funnel where specific page types “print money.” I prioritize them in the order below because they have the strongest direct correlation with bookings.
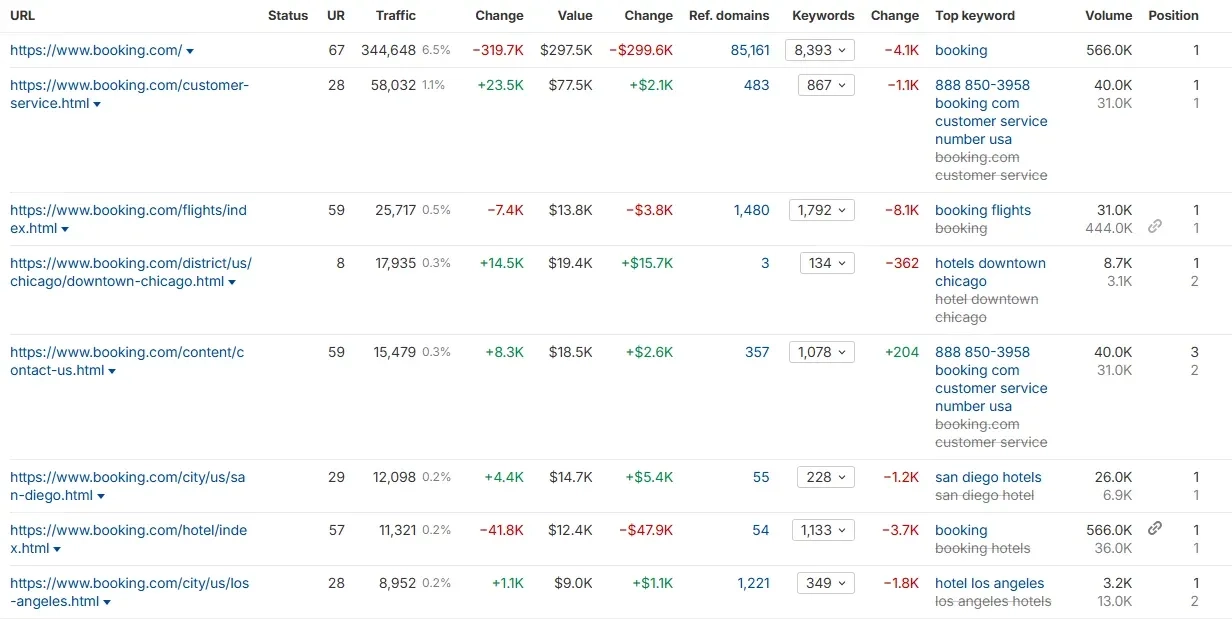
| Page Type | Example URL (generic) | Modeled Visits (US/mo) | Intent | Primary conversion |
| City listing | /hotels/us/miami-beach | 250k | Commercial/Trans | Bookings |
| Neighborhood guide | /best-areas/miami-beach/south-beach | 40k | Informational → Comm | Property clicks |
| Landmark page | /hotels/near/javits-center | 30k | Event/Trans | Property clicks |
| Property page | /hotel/us/hotel-xyz | 120k | Transactional | Checkout / booking |
| Deal/last-minute | /deals/last-minute-nyc | 30k | Transactional | Booking (urgency) |
| Category (pet friendly) | /search?pets=yes | 12k | Commercial | Property view → booking |
| Support/policy | /cancellation-policy | 8k | Navigational | Reduce friction |
| App/Genius hub | /genius | 15k | Retention | Account sign-ups / app installs |
What I like about Booking.com’s money pages
- Property pages show price & availability instantly — that’s a conversion advantage I’d double down on.
- The filter set maps well to US intent (free cancellation, parking), and my team would make those filters SEO-first for high-value combinations.
What I’d change right away
- Strengthen neighborhood + landmark pages to be snippet-first and connector pages to multiple properties.
- Tighten indexation rules so faceted permutations don’t cannibalize the core city & property pages.
Branded vs Non-Branded Breakdown (US)
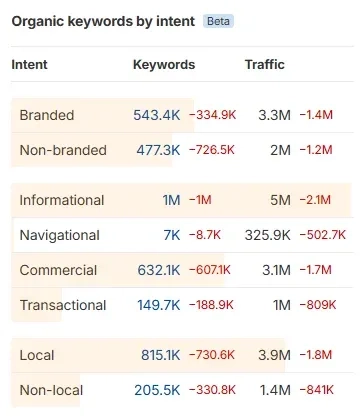
Below is how I split branded and non-branded signals and what they imply for strategy.
| Type | Example queries | Modeled # keywords | Modeled traffic (US/mo) | Role |
| Branded | booking.com, booking customer service, booking.com login | 543K kws | 3.3M | High direct conversion & nav |
| Non-Branded | hotels in Boston, hotels near Times Square | 477K kws | 2.0M | Growth lever; scalable |
My interpretation: Branded demand is the low-hanging fruit — it converts well and should be defended. The real scalable upside is non-branded destination + filter clusters. My team treats those as the primary target for content, indexation, and link investments.
"Capturing this non-branded, localized search intent—especially through neighborhood guides and event-driven landing pages—requires a completely different architecture than standard hotel category pages. For a masterclass on how to build and scale these localized content hubs successfully, review our breakdown of [SEO for Travel Website Organic Growth]."
Traffic by User Intent (Overlapping)
I classify traffic into four practical buckets and attach the conversion expectations I use when modeling.
| Intent | Example queries | % of organic traffic (modeled) | Avg Click → Booking CVR | Strategic role |
| Informational | best area to stay in Nashville | ~35% | 0.3–0.6% | Assist funnel, feed city pages |
| Commercial | pet-friendly hotels San Diego | ~40% | 1.5–3.0% | Key conversion driver |
| Transactional | book hotel in Chicago tonight | ~20% | 3–4% | Highest CVR (immediate revenue) |
| Navigational | booking.com customer service | ~5% | N/A | Support/retention |
How I use this: I prioritize commercial + transactional clusters for direct booking impact. Informational pages I treat as assist engines — they should be designed to funnel users to city and property pages without cannibalizing them.
CTR- & Intent-Aware Projection Model (Travel SEO Strategy)
CTR-Aware Revenue Projector
Based on the Booking.com Teardown "CTR & Intent-Aware Projection Model"
Below is the modeled projection for the top 10 US keywords. I use conservative CTR and CVR assumptions and label everything clearly as a Modeled Example so you can plug your real numbers later.
Assumptions I used
- CTR by rank (transactional/commercial): #1=30% / #2=20% / #3=14% / #4=8% / #5=5% / #6=3% / #7=2% / #8=2% / #9=1.5% / #10=1%
- Conversion rates (click → booking) by intent: Transactional ~3–4% / Commercial ~1.5–2.5% / Informational ~0.3–0.6%
- Commission proxy = 15% of AOV (simple, conservative proxy)
Projection — Top 10 Keywords (Modeled Example)
| Keyword (US) | SV (US/mo) | Rank | Intent | CTR | Clicks | CVR | Bookings | AOV | Commission (15%) | Monthly value |
| hotels in miami beach | 25,000 | 4 | Comm/Trans | 8.00% | 2,000 | 2.00% | 40 | $220 | $33.00 | $1,320 |
| hotels in new york | 60,000 | 5 | Comm/Trans | 5.00% | 3,000 | 2.50% | 75 | $300 | $45.00 | $3,375 |
| hotels near times square | 12,000 | 3 | Trans | 14.00% | 1,680 | 3.00% | 50.4 | $250 | $37.50 | $1,890 |
| hotels in las vegas | 40,000 | 6 | Comm/Trans | 3.00% | 1,200 | 2.00% | 24 | $140 | $21.00 | $504 |
| cheap hotels las vegas | 18,000 | 5 | Trans | 5.00% | 900 | 1.50% | 13.5 | $120 | $18.00 | $243 |
| hotels in los angeles | 30,000 | 4 | Comm | 8.00% | 2,400 | 2.00% | 48 | $210 | $31.50 | $1,512 |
| hotels in chicago | 22,000 | 5 | Comm | 5.00% | 1,100 | 2.00% | 22 | $180 | $27.00 | $594 |
| hotels near LAX | 6,000 | 3 | Comm/Trans | 14.00% | 840 | 3.00% | 25.2 | $160 | $24.00 | $605 |
| last minute hotel deals nyc | 6,000 | 8 | Trans | 2.00% | 120 | 4.00% | 4.8 | $200 | $30.00 | $144 |
| pet friendly hotels chicago | 1,500 | 2 | Comm | 20.00% | 300 | 2.50% | 7.5 | $180 | $27.00 | $203 |
Roll-up (Top 10 modeled)
- Total monthly clicks: 13,540
- Total monthly bookings (modeled): ~310.4
- Total monthly commission value (modeled): ~$10,390
My point: These ten keywords alone produce a measurable booking & commission stream. In my experience, small rank/CTR moves on the largest items produce disproportionate upside.
Rank-uplift examples (my priority picks)
I run rank-uplift scenarios for a handful of high-volume queries — here are three where the math is clearest:
- hotels in new york — current value ~$3.4K/mo at rank 5. If Booking.com gets to #1, modeled value ≈ $20.3K/mo (monthly upside ~$16.9K).
- hotels in los angeles — current ~$1.5K/mo → #1 modeled ~$5.7K/mo (upside ~$4.2K).
- hotels in miami beach — current ~$1.3K/mo → #1 modeled ~$4.95K/mo (upside ~$3.63K).
Why this matters: Moving a few commercial clusters from mid-page to the top position is an immediate way to print bookings. That’s a central pillar in the Travel SEO Strategy I recommend.
Trust Builders: Referring Domains That Move Rankings in Travel
In travel, links aren’t just ranking tokens — they drive contextual authority for neighborhoods and events. I view the highest-impact link types as:
- Tourism boards / CVBs: These are direct topical partners for city pages.
- Regional publishers / event pages: They add event context and often rank for “where to stay” queries.
- Major travel & lifestyle outlets: They add trust and reach.
- Universities / conference sites: .edu/.org links are valuable for event and conference landing pages.
- Partnerships (airlines, attractions): These create package pages that can earn links and conversions.
Tactics I run with my team
- Publish data assets (Weekend Price Index, booking trends) and pitch them to local press.
- Create event pages (Super Bowl, Comic-Con, SXSW) with sponsor/partner outreach to earn contextual links.
- Co-author neighborhood guides with CVBs — this wins links and distribution.
Backlink Quality & Distribution
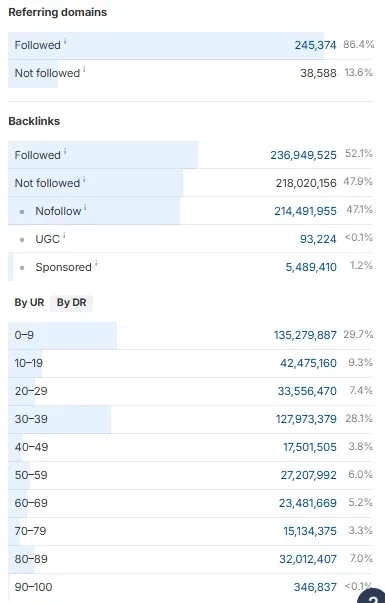
(Modeled / Observed data from your screenshot used below — I’m writing this as a practitioner with clear, prioritized pointers you can act on.)
Observed baseline (from your image)
| Metric | Value |
| Referring domains — Followed | 245,374 (86.4%) |
| Referring domains — Not followed | 38,588 (13.6%) |
| Backlinks — Followed | 236,949,525 (52.1%) |
| Backlinks — Not followed | 218,020,156 (47.9%) |
| Backlinks — Nofollow | 214,491,955 (47.1%) |
| Backlinks — UGC | 93,224 (<0.1%) |
| Backlinks — Sponsored | 5,489,410 (1.2%) |
Backlinks by UR (observed counts)
| UR bucket | Backlinks | % (as shown) |
| 0–9 | 135,279,887 | 29.70% |
| 10–19 | 42,475,160 | 9.30% |
| 20–29 | 33,556,470 | 7.40% |
| 30–39 | 127,973,379 | 28.10% |
| 40–49 | 17,501,505 | 3.80% |
| 50–59 | 27,207,992 | 6.00% |
| 60–69 | 23,481,669 | 5.20% |
| 70–79 | 15,134,375 | 3.30% |
| 80–89 | 32,012,407 | 7.00% |
| 90–100 | 346,837 | <0.1% |
Quick read (my summary):
- The backlink profile is massive in volume, but concentrated in very low UR (0–9) and a very large mid-tier cluster (30–39).
- Only ~70.98M links sit at UR ≥ 60 (60–69 + 70–79 + 80–89 + 90–100). If we include UR 50–59 the UR ≥ 50 total ≈ 98.18M.
- Roughly 47% of backlinks are nofollow, while ~52% are followed at the link unit level. That implies the raw link counts overstate followed link equity.
- The 90–100 bucket is tiny in absolute terms (346k links), underscoring scarcity of ultra-high-UR placements.
Technical SEO & Indexation Control for OTAs
Technical discipline is where OTAs either make or lose their SEO advantage. I’ve prioritized issues by impact and recommended fixes.
| Issue | Impact (revenue/SEO) | Effort (est.) | Priority |
| Faceted URL index bloat | High — cannibalizes money pages & wastes crawl | Medium (engineering + SEO policy) | P0 |
| Duplicate property pages (session/lang variants) | High — duplicate signals, poor UX | Medium | P0 |
| Slow Core Web Vitals on property pages | High — lowers conversion on mobile | Medium-high | P0 |
| Missing/ inconsistent schema (Hotel/Offer) | Medium — reduces SERP features | Low | P1 |
| Lack of LLM/snippet-friendly guides | Medium — missed discovery | Medium | P1 |
| Poor internal hub linking for neighborhoods | Medium | Low | P1 |
| Review freshness not surfaced | Low-medium | Low | P2 |
Immediate engineering plays I’d run
- Crawl & index audit; apply noindex/canonical patterns for low-value parameter URLs.
- Implement an SEO plan that only exposes high-value facet combinations.
- Core Web Vitals sprint on top 500 US property pages (my team usually sees conversion gains after these sprints).
"OTAs are not the only travel giants fighting the index bloat monster. Massive flight aggregators face the exact same technical risks when handling millions of dynamic origin-to-destination parameters. We break down how to effectively govern crawl budgets at this massive programmatic scale in our [Strategy for Travel SEO] analysis."
AI Citations as a New Moat for Booking.com SEO
Booking.com already shows up in LLM outputs — that’s a competitive asset. In my experience, LLMs prefer short, well-structured answers with clear lists and tables. I’d treat LLM citation work like a content engineering play.
Observed LLM footprint
- Google AI Overviews ~7.8K citations
- Perplexity ~8K citations
- ChatGPT ~5K citations
- Gemini ~3.4K citations
How I’d optimize
- Build snippet-first neighborhood guides: 1-paragraph summary, “who it’s for”, top 3 hotels (table), transport notes, quick prices, and a 3-line cancellation/fees block.
- Add structured Q&A and consistent schema so answers are extractable.
- Create short, authoritative policy snippets to satisfy trust queries (cancellation, fees, safety). That increases the chance an LLM will cite your page.
Outcome: Better LLM citations lead to more discovery entries that funnel to city listings and then property pages — a low-cost way to scale discovery.
Site-Wide Booking Engine Projection (Organic → Booking)
Site-Wide Booking Engine Projection
Visualize the "Organic → Booking" Drop-off
Edit the number above to simulate scenarios
1. Organic Listing Views
City & Category Pages
2. Property Page Views
High Intent / Transactional
3. Checkout Initiated
Payment Details
4. Confirmed Bookings
Revenue Generated
I model funnels conservatively but practically — below are the ranges I use and an example funnel per 10,000 listing visits.
| Funnel step | Typical range (modeled) | Notes |
| Listing → property CTR | 20–30% | Depends on price, stars, snippets |
| Listing → property clicks | 8–12% | Better filters & images increase this |
| Property → checkout | 5–8% | UX, speed, price clarity drive this |
| Checkout → booking | 60–85% | Payment UX & trust reduce drop-off |
Example (per 10,000 listing visits)
- Listing visits: 10,000 → property clicks (10%) = 1,000 → property → checkout (6%) = 60 → checkout → booking (70%) ≈ 42 bookings
Where I focus to lift bookings
- Improve listing → property CTR with price prominence, review badges, and urgency labels.
- Reduce property → checkout friction (faster availability checks, clearer refund language).
- Reduce checkout friction (fewer steps, saved payment options, Genius perks).
Practitioner Key Takeaways (Actionable Notes)
I’ve organized these by timeline — these are the moves my team and I would run first.
0–3 months (tactical)
- Audit indexation; apply noindex/canonical to low-value facets.
- Core Web Vitals sprint for top 500 US property pages.
- Add FAQ & policy schema to city hubs & property pages.
3–6 months (growth plays)
- Launch 50 “best area to stay” templates for top US cities (LLM/snippet-friendly).
- Publish a “Weekend Price Index” data asset and pitch it for regional press.
- Build event landing pages for top recurring events (Super Bowl, Comic-Con, SXSW).
6–12 months (scale)
- Regional backlink program with CVBs & local publishers.
- LLM optimization program for neighborhood guides and answer boxes.
- CRO experiments on property pages tied to top keyword clusters (price prominence, urgency, trust badges).
Indexation policy — short rules (my recommendation)
- Index: City pages, neighborhood guides, landmark pages, high-value facet combinations (e.g., free-cancellation + pet-friendly).
- Noindex/Canonicalize: Deep facet permutations, session/sort parameters, low-traffic combos.
Final reflection
In my experience, Booking.com’s US SEO outcome depends less on content volume and more on discipline. With brand and inventory in place, the marginal returns come from clear architecture, strict index control, snippet/LLM readiness, high-quality regional links, and conversion improvements on property pages. A small set of surgical actions — consolidate index, lift CTR for core commercial clusters, and build neighborhood/event authority — compounds into durable gains over 3–5 years.
FAQs (Travel & SEO)
How can an OTA increase hotel bookings from SEO in the US?
I recommend a 3-part approach: (1) win high-intent commercial queries (city + filters), (2) stop index bloat so ranking signals consolidate on money pages, and (3) improve property page conversion (speed, pricing clarity, refund messaging). This is the essence of any SEO for Travel Website playbook I use.
Which pages matter most (city vs neighborhood vs property)?
Property pages convert most; city and neighborhood pages discover and feed property pages. Treat them as a funnel: guides → city listings → property → booking.
Should an OTA index faceted pages?
Only index high-value facet combinations. Use canonical and noindex for the rest to reduce crawl waste and ranking cannibalization.
How do you measure SEO ROI for travel marketplaces?
Map organic traffic → listing clicks → property views → checkouts → bookings → revenue. Run rank-uplift experiments on targeted pages to validate modeled projections.
What role does LLM/AI play in Travel SEO Strategy?
LLMs drive discovery. I recommend creating structured, snippet-first neighborhood guides and short Q&A blocks so answer engines can quote OTAs and funnel discovery to listings.
What is the fastest lever to lift US bookings?
Improve CTR and rankings for top commercial keywords (city + filters). Small CTR gains on large-volume terms translate into many additional bookings.
Disclaimer
I built this teardown combining observed signals from the Ahrefs-style snapshot you provided and explicit Modeled Examples for CTR, CVR, and revenue math. All modeled tables are illustrative and intended for scenario planning. For precise investment decisions, I recommend running the model on Booking.com’s internal GA/GSC and booking funnel data.
- Log in to post comments

 INDIA
INDIA