


How to Increase Student Enrollment in College
Increasing college enrollment is not the same problem as generating more applications. For four-year institutions with an admission-to-deposit process, the post-admit opportunity is to separate undecided admits from committed students, understand where each group stalls, and remove avoidable decision or completion friction before matriculation.
If your problem is too few qualified applicants, start with our Student Recruitment Strategies guide. This article focuses on what happens after application/admission.
7 Ways to Increase Student Enrollment
- Measure the post-admit funnel stage by stage.
- Separate undecided admits from committed students.
- Find the matriculation steps where committed students stall.
- Prioritize financial-aid and other high-friction tasks.
- Replace static checklists with tracked, two-way intervention.
- Coordinate the whole campus around one enrollment journey.
- Measure melt and intervention lift by segment.
Jump to
- Who This Article Is For
- Recruitment Is Not Enrollment
- What the National Data Can — and Cannot — Tell You
- Why Melt Is a Better Intervention Metric
- Where Admitted Students Actually Stall
- What Experimental Evidence Says Works — and on Whom
- Undecided Admits Need Decision Support, Not Melt Messaging
- Why Checklists Alone Are Not Enough
- 7 Ways to Increase Student Enrollment
- A Practical Enrollment Intervention Matrix
- How to Measure Enrollment Improvement
- Where Search Can Reduce Post-Admit Information Friction
- Frequently Asked Questions
Who This Article Is For
This guide is primarily for four-year colleges and universities that use an admission-to-intent or deposit process for an incoming class. Graduate programs can use the same diagnostic logic, but their decision timelines, funding models and enrollment steps may differ. Open-access community colleges also face transition friction and summer melt, but a conventional admit-to-yield model may be less useful where admission is not selective.
If too few qualified students are discovering and applying to the institution, recruitment is the constraint. If the institution has an adequate admit pool but too few admitted students ultimately arrive, post-admit decision support, yield and melt deserve separate measurement.
Recruitment Is Not Enrollment
Recruitment and enrollment touch the same student journey, but they solve different problems.
| Recruitment | Enrollment / yield |
|---|---|
| Population: prospective students who may apply | Population: applicants and admitted students |
| Stages: discovery → inquiry → application | Stages: admit → decision/intent → deposit → aid → housing → orientation → registration → matriculation |
| Core metric: qualified applicants / applications | Core metrics: yield, melt and stage-to-stage conversion |
| Failure mode: student never discovers or applies | Failure mode: admitted student chooses another option or fails to complete matriculation |
| Typical owners: marketing and admissions recruitment | Typical owners: admissions plus financial aid, housing, advising and registrar |
| Typical interventions: search, content, outreach, events, advertising | Typical interventions: decision support, friction removal, task-aware nudges and escalation |
Retention begins after the student is enrolled and attending. It is a third problem and should be measured separately.
What the National Data Can — and Cannot — Tell You
National Student Clearinghouse data shows that overall postsecondary headcount was still growing in spring 2026: total enrollment rose 1.0% year over year, with undergraduate enrollment up 1.3%.
That is useful market context, but it is not a measure of incoming-class yield because spring headcount includes continuing students. Community colleges also drove much of the growth, and many are open-access institutions where a conventional admit-to-yield model applies differently.
The practical lesson is narrower: do not diagnose an institution's yield problem from national enrollment headlines. Measure the institution's own admitted-student funnel.
NCES reports that 62% of 2022 high school completers enrolled in college immediately after high school, with no measurable difference from 2012 or 2021. Again, that is college-going context, not an institutional yield benchmark.
Why Melt Is a Better Intervention Metric
Yield is the share of admitted students who ultimately enroll. But once a student has signaled intent or paid a deposit, melt becomes a more useful operational metric:
Melt rateDeposited or committed students who do not matriculate ÷ deposited or committed students
That distinction matches the strongest institution-run intervention evidence. Task-based support is best understood as preventing avoidable loss among students already moving toward enrollment, not as applying the same lift to every admit.
A simple melt example:
| Scenario | Deposited students | Melt rate | Matriculated |
|---|---|---|---|
| Baseline | 1,400 | 10% | 1,260 |
| Melt reduced by one-fifth | 1,400 | 8% | 1,288 |
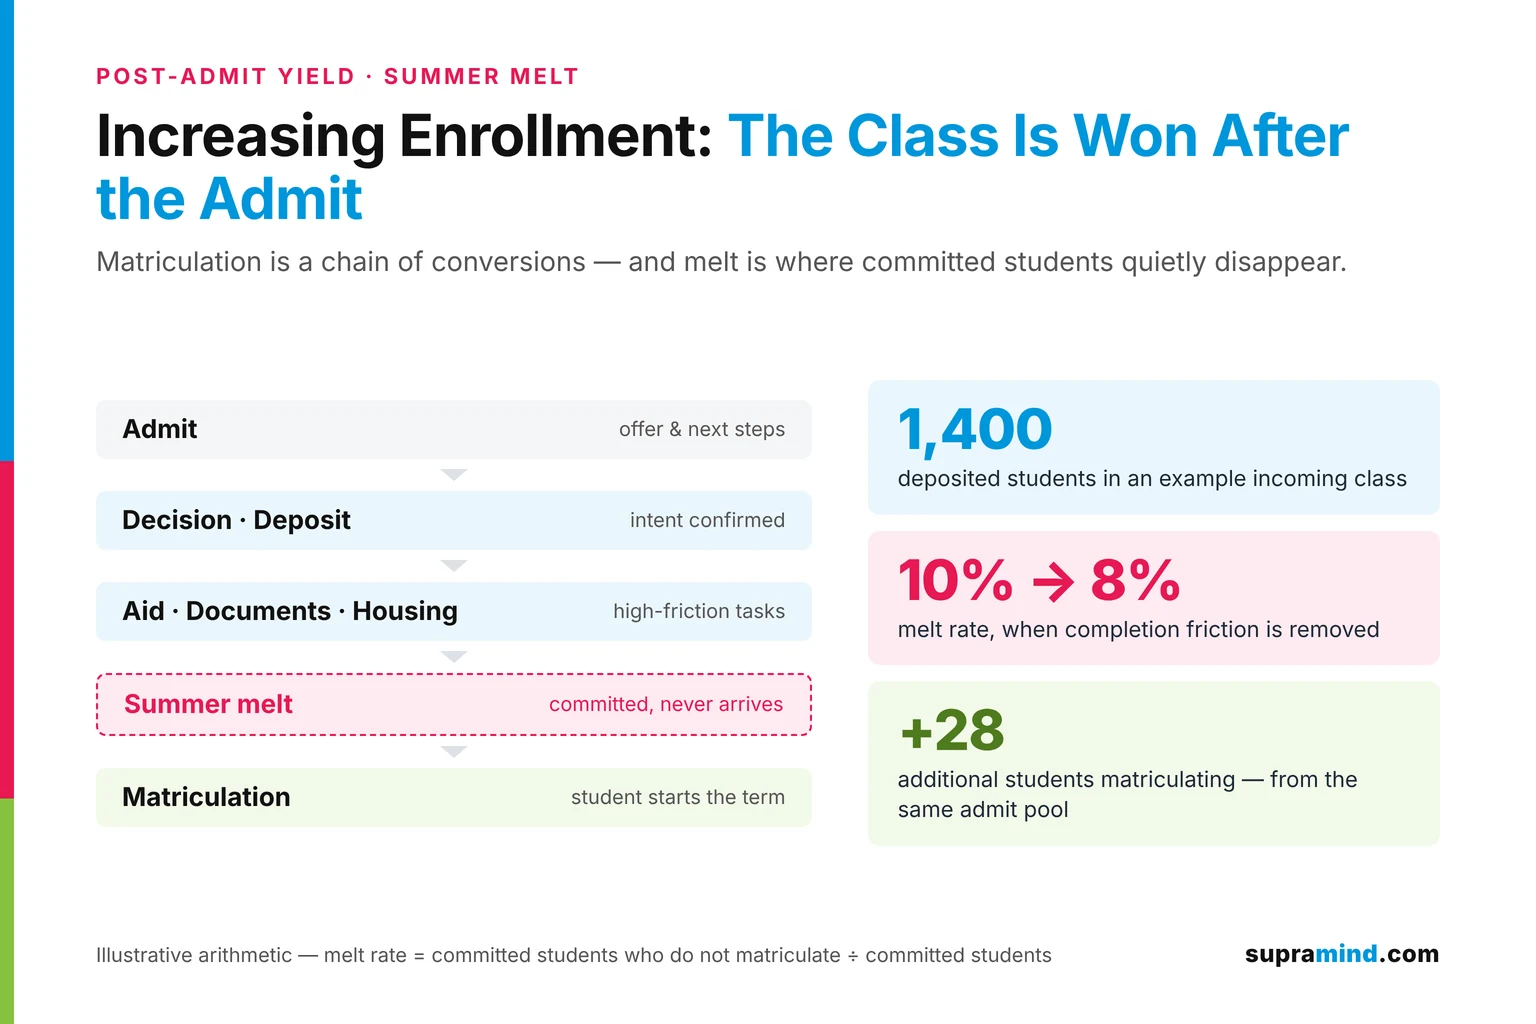
Reducing melt from 10% to 8% would mean 28 additional students matriculating from the same deposited cohort. The one-fifth reduction is illustrative arithmetic, not a forecast or benchmark.
For undecided admits, the problem is different. They are still choosing among options, so institutions need decision support rather than treating them as committed students who merely forgot a form.
Where Admitted Students Actually Stall
Matriculation is not one conversion. It is a chain of conversions owned by multiple departments.
| Stage | What the student must do | Typical owner | Failure signal |
|---|---|---|---|
| Admission | Understand offer and next steps | Admissions | Offer opened but no next action |
| Decision / intent | Decide whether institution remains a serious choice | Admissions / program | No intent signal; questions unresolved |
| Deposit | Confirm intent or pay deposit | Admissions / bursar | Deadline approaching; no deposit |
| Financial aid | Complete verification, understand/accept aid, resolve holds | Financial aid | Verification or award action incomplete |
| Documents | Submit final transcript and required forms | Admissions / registrar | Missing document near deadline |
| Placement / advising | Complete required tests or advising | Advising / academic unit | Appointment or assessment incomplete |
| Housing | Apply, select or confirm housing | Housing | Required housing step incomplete |
| Orientation | Register and attend | Student affairs / orientation | Not registered or no-show |
| Registration | Clear holds and register for classes | Registrar / advising | Expected matriculant not registered |
| Matriculation | Arrive / begin term | Institution-wide | Student fails to start |
Admissions may win the student while a bottleneck in financial aid, housing or registration loses them. A useful enrollment dashboard therefore shows stage-to-stage conversion and stalled students, not only admits and final enrollment.
What Experimental Evidence Says Works — and on Whom
The evidence does not support a generic claim that personalized messaging increases enrollment. The effect depends on who owns the intervention, which students receive it and whether the outreach helps resolve a real next step.
Georgia State: institution-run support for committed students
A field experiment at Georgia State University tested Pounce, a text-based virtual assistant connected to university data and escalation to admissions counselors.
Among students who had already committed to Georgia State, the intervention increased timely enrollment by 3.3 percentage points and reduced summer melt by about 21%. Researchers found essentially no enrollment effect among admitted students who had not reported an intention to enroll at Georgia State.
The useful interpretation is narrow: the intervention worked primarily as friction removal for students who had already chosen the institution. It is not evidence that automated messaging persuades undecided admits.
uAspire: evidence that task friction matters, not a college-run yield result
A 2014 nonprofit-run texting pilot involving 4,882 college-intending high school graduates across five US cities sent personalized reminders about tasks needed to matriculate at whichever college each student planned to attend.
Overall college enrollment was 68.0% among students offered the texts versus 64.9% among those not offered them, a 3.1 percentage-point difference. Among students with an expected family contribution (EFC) of $0 — the lowest-income group used in the evaluation — enrollment increased from 66.4% to 72.1%.
This supports the idea that financial and administrative task friction can matter. It is not evidence of a yield intervention run by a college on its own admitted students.
Counter-evidence: generic messaging does not reliably scale
Avery, Castleman, Hurwitz, Long and Page later tested digital messaging at much larger scale. With national nonprofit partners, outreach covered students in more than 700 high schools that primarily served low-income students. The national version produced null and negative effects. The July 2024 What Works Clearinghouse Practice Guide review of the national sample records statistically significant negative effects for several college-enrollment outcomes, including enrollment in any NSC-covered college within six months of graduation. The Texas school-based subgroup findings come from the Avery et al. paper itself rather than this WWC review.
That strengthens the operational lesson: messaging is not itself the intervention. The authors also note that part of the negative national effect may reflect advisors steering students away from college options they viewed as financially unsustainable, consistent with uAspire's advising stance. The more defensible pattern is timely support connected to a specific task or barrier, informed by local/student data, with a route to human help when needed.
| Evidence | Population / operator | Observed result | What it supports |
|---|---|---|---|
| GSU Pounce | Georgia State admitted students; institution-run | +3.3pp timely enrollment among committed students; about 21% melt reduction | Task-aware institutional support can reduce friction for committed students |
| uAspire / federal pilot | College-intending high school graduates; nonprofit/high-school channel | 64.9% → 68.0% overall; EFC $0: 66.4% → 72.1% | Task friction matters, especially where financial/information barriers are high |
| Avery et al. 2021 | High school students; national nonprofit and school-based versions | Null/negative nationally; enrollment gains only for some subgroups in school-based version | Generic scalable messaging is not reliably effective |
Important limitation: these studies are not interchangeable. GSU is the clearest institution-run post-admit example here. uAspire and Avery et al. primarily study the transition from high school into college. Use them to understand mechanisms and limits, not to promise a particular yield lift.
Undecided Admits Need Decision Support, Not Melt Messaging
Not every admitted student who has not deposited is stuck on a task. Many are still comparing institutions. They remain in scope for enrollment strategy, but the objective is different: help them make an informed decision rather than treating them as committed students who need a reminder.
Aid-award timing and clarity
Track when an aid award becomes available, whether the student can understand the net price, and whether unresolved verification or terminology makes comparison difficult. The goal is clarity, not simply sending the same award message again.
Program-specific outreach
An admitted student choosing between similar programs may need a question answered by the department, faculty or an appropriate program representative. Route program-specific questions to people who can answer them accurately rather than keeping every conversation inside a generic admissions sequence.
Admitted-student events
Use events as decision support: help students test fit, meet relevant people and resolve questions. Measure attendance and subsequent intent/deposit movement, but do not assume attendance itself caused the decision.
Capture reasons for declining
When an admitted student chooses not to enroll, ask why and record the reason in a usable taxonomy: price/aid, competing institution, program fit, location, timing, personal circumstances or another reason. Over time, this helps separate operational friction from genuine preference.
The key is segmentation: committed students need completion support; undecided admits need decision support. Mixing the two produces generic communication that is less useful to both.
Why Checklists Alone Are Not Enough
A portal checklist is useful. It tells students what to do.
It does not tell the institution who is stuck.
The stronger model is a closed loop:
Required task → completion data → stalled-student flag → targeted nudge → two-way help → human escalation → completion
A static checklist assumes the student will notice a missing task, understand it, know who to contact and act before the deadline.
A tracked intervention asks: Which admitted students have not completed the next required step, and what is preventing them?
At Georgia State, outreach was tailored using institution-held data. Students who had already completed a task did not need irrelevant reminders, and questions the system could not answer could be escalated to university admissions counselors. That is materially different from broadcasting a generic reminder sequence.
7 Ways to Increase Student Enrollment
1. Measure the post-admit funnel stage by stage
Do not wait until census day to discover that the class is short. Track conversion between admit, decision/intent, deposit, aid completion, orientation, registration and matriculation.
Aggregate yield tells you the outcome. Stage conversion tells you where to act.
2. Separate undecided admits from committed students
A deposited student with an unresolved aid hold has a different problem from an admit comparing three institutions.
Use decision support for the second group and completion support for the first. The GSU evidence is a useful warning against assuming that task nudges will change the preference of an undecided student.
3. Find the matriculation steps where committed students stall
For every incoming cohort, calculate:
Stage conversionStudents completing the stage ÷ students eligible to complete it
Then segment by program, student type and other lawful, useful dimensions available to the institution. Concentrated friction tells you where operational attention belongs.
4. Prioritize financial-aid and other high-friction tasks
Financial aid is not merely a communication topic. It is a process.
Track incomplete verification, unresolved holds, award acceptance and other required actions. Make ownership and escalation explicit.
The uAspire evaluation found a larger enrollment effect among students with EFC $0. Treat that as evidence that friction may matter more for students facing greater financial constraints.
5. Replace static checklists with tracked, two-way intervention
Keep the checklist, but add monitoring. A useful system should know which task is incomplete, how close the deadline is, whether the student has been contacted, whether the student replied, whether the issue requires a human, and whether the task was subsequently completed.
The goal is not more messages. It is fewer unresolved blockers.
6. Coordinate the whole campus around one enrollment journey
The student experiences one institution, not five departments.
Assign an owner to each critical matriculation step and define what happens when a student stalls. Enrollment leadership does not need to own housing or financial-aid operations, but it needs visibility into whether those steps are preventing matriculation.
7. Measure melt and intervention lift by segment
Overall enrollment can hide where an intervention works.
For each intervention, compare eligible students, students reached, task completion, subsequent-stage completion and final matriculation. Where possible, use a credible comparison group or phased rollout rather than attributing every improvement to the intervention.
A Practical Enrollment Intervention Matrix
| Student state | Likely problem | Appropriate response | Do not assume |
|---|---|---|---|
| Committed + task incomplete | Process friction | Specific reminder, two-way help, escalation | They need more persuasion |
| Committed + unresolved aid issue | Financial/administrative barrier | Human financial-aid intervention | Another generic email will solve it |
| Undecided + no deposit | Choice unresolved | Aid clarity, program contact, decision-support event | Task reminders alone will change preference |
| All required tasks complete + no matriculation | Late preference change or unobserved barrier | Direct outreach and reason capture | The portal caused the loss |
| High-friction segment | Structural complexity | Earlier monitoring and targeted support | One intervention works equally for everyone |
How to Measure Enrollment Improvement
| Metric | Formula / definition | What it tells you |
|---|---|---|
| Yield rate | Enrolled ÷ admitted | Final admit-to-enrollment conversion |
| Deposit / intent conversion | Deposits or intent confirmations ÷ admitted | Early commitment |
| Melt rate | Deposited/committed students who do not matriculate ÷ deposited/committed students | Loss after commitment |
| Aid completion rate | Students completing required aid steps ÷ students requiring them | Financial-process friction |
| Orientation completion | Students completing orientation ÷ eligible students | Pre-arrival progression |
| Registration completion | Registered students ÷ expected matriculants | Readiness to start |
| Stage stall rate | Eligible students missing a required next step ÷ eligible students | Where intervention is needed |
| Intervention lift | Completion/enrollment difference versus a credible comparison | Whether the intervention likely helped |
| Decline-reason mix | Non-enrolling admits by recorded reason | Whether losses are preference, price, fit or process related |
Do not use application growth as proof that post-admit enrollment strategy improved. Applications belong to the recruitment funnel.
Likewise, do not use first-year persistence as proof of enrollment performance. Persistence belongs to retention.
Where Search Can Reduce Post-Admit Information Friction
SEO should not be credited with improving yield unless an institution can connect search-originated behavior to enrollment outcomes. But search still matters after admission because admitted students and families may use Google rather than a portal to find operational answers.
Typical searches can include:
- [college] housing deadline
- [college] financial aid verification
- [college] orientation dates
- [college] deposit deadline
- [college] final transcript deadline
If critical answers are available only behind a login, buried in a PDF, outdated, or inconsistent across admissions and student-services pages, that becomes an information-friction problem.
The practical search role is narrow: make public, non-sensitive process information accurate, current and easy to find; ensure important dates and requirements agree across relevant pages; and route students to the secure portal when an action requires authentication.
That does not prove SEO caused an enrollment. It reduces the chance that a student searching for a required next step receives an unclear or conflicting answer.
For institutions whose main problem is discovery and applicant generation, see our Student Recruitment Strategies guide
Frequently Asked Questions
How can colleges increase student enrollment?
First diagnose the constraint. If the institution needs more qualified applicants, improve recruitment. If it has a healthy admit pool, separate undecided admits from committed students, measure the post-admit funnel, remove completion friction and track melt.
What is college yield rate?
Yield rate is the percentage of admitted students who ultimately enroll. It should be complemented by deposit/intent conversion, melt and stage-level metrics because final yield alone does not show where admitted students were lost.
What is summer melt?
Summer melt is the failure of college-intending or committed students to matriculate. For an institution with a deposit or intent step, melt rate can be measured as committed students who do not matriculate divided by committed students.
Do text messages increase college enrollment?
Sometimes, in specific contexts. Georgia State's institution-run Pounce intervention increased timely enrollment by 3.3 percentage points among committed students and reduced summer melt by about 21%, but had essentially no enrollment effect among admits who had not signaled intent to enroll there. A nonprofit-run uAspire pilot increased college enrollment overall from 64.9% to 68.0% among college-intending high school graduates, with a larger effect for students with EFC $0. By contrast, Avery et al. found null and negative effects in a much larger national messaging intervention. The evidence supports targeted, task-aware support more strongly than generic messaging.
How should colleges work with undecided admits?
Treat them as decision-makers rather than stalled matriculants. Improve aid-award clarity, route program-specific questions to appropriate academic contacts, use admitted-student events to resolve fit questions, and capture reasons when students decline.
Should colleges focus on recruitment or yield?
Measure where the funnel is constrained. Too few qualified applications indicates a recruitment problem. An adequate admit pool with weak intent/deposit or matriculation conversion indicates a post-admit yield problem. Many institutions need both, but they should not use the same tactics or KPIs.
What is the difference between enrollment and retention?
Enrollment ends when the student matriculates and begins the term. Retention measures whether enrolled students persist after they start. Mixing them can hide whether the institution has an acquisition, decision, matriculation or persistence problem.
Sources and Editorial References
- 1. National Student Clearinghouse Research Center — Final Spring Enrollment Trends, published June 4, 2026.
- 2. National Center for Education Statistics — Condition of Education: Immediate College Enrollment Rate.
- 3. Page, L. C. & Gehlbach, H. — “How an Artificially Intelligent Virtual Assistant Helps Students Navigate the Road to College,” AERA Open, 2017.
- 4. U.S. Office of Evaluation Sciences — “Reducing Summer Melt,” 2014 pilot/evaluation.
- 5. Avery, C., Castleman, B. L., Hurwitz, M., Long, B. T. & Page, L. C. — “Digital Messaging to Improve College Enrollment and Success,” Economics of Education Review, 2021.
- 6. What Works Clearinghouse — July 2024 Practice Guide review of the Avery et al. (2021) national sample.
- Log in to post comments


 INDIA
INDIA