


7 Student Recruitment Strategies for US Colleges
Student recruitment is becoming harder to judge from application volume alone. In Common App's 2025-26 cycle, total applications grew faster than the number of applicants, while students applied to more institutions. For US colleges, the practical priority is to improve discovery, focus on applicant segments and markets where demand is changing, make program information easier to find, and measure inquiry and application growth separately.
7 Strategies at a Glance
- Measure discovery separately from applications. Track non-brand visibility, program-page traffic and inquiries before relying on application totals.
- Build recruitment around program-level demand. Map how students search by subject, program, career outcome, cost, eligibility and location.
- Reallocate recruitment by applicant growth. Compare your historical markets with current applicant growth rather than distributing effort evenly.
- Audit what prospective students can actually find. Test priority program, cost, aid, deadline and admissions information in search and AI assistants.
- Redefine your competitive set. Benchmark against the institutions that appear for the searches students actually make, not only traditional peer institutions.
- Make critical recruitment information machine-readable and easy to access. Do not leave essential program, fee or admissions information only in PDFs or images.
- Treat standard recruitment channels as table stakes. CRM, email, events, social media and student ambassadors matter after discovery, but they cannot compensate for being absent when students build their consideration set.
Jump to
- What the latest application data tells us
- The application inflation problem
- The US demographic outlook
- Where applicant growth is happening
- Turning demographic segments into observable search signals
- Why discovery should be a recruitment priority
- A practical AI visibility audit
- How student search behavior is changing
- The seven strategies in detail
- How to measure student recruitment
- Frequently asked questions
What the Latest Application Data Tells Us
At first glance, the latest US college application numbers look encouraging. Common App's 2025-26 end-of-season report covers 1,146 member institutions and shows continued growth in first-year application activity.
But application volume does not answer the most important recruitment question: are significantly more prospective students entering the market, or are students simply applying to more institutions?
The data points largely to the second.
| Recruitment signal | 2025-26 result | What it means |
|---|---|---|
| Distinct first-year applicants | 1,527,328; +2% YoY | Applicant growth was modest |
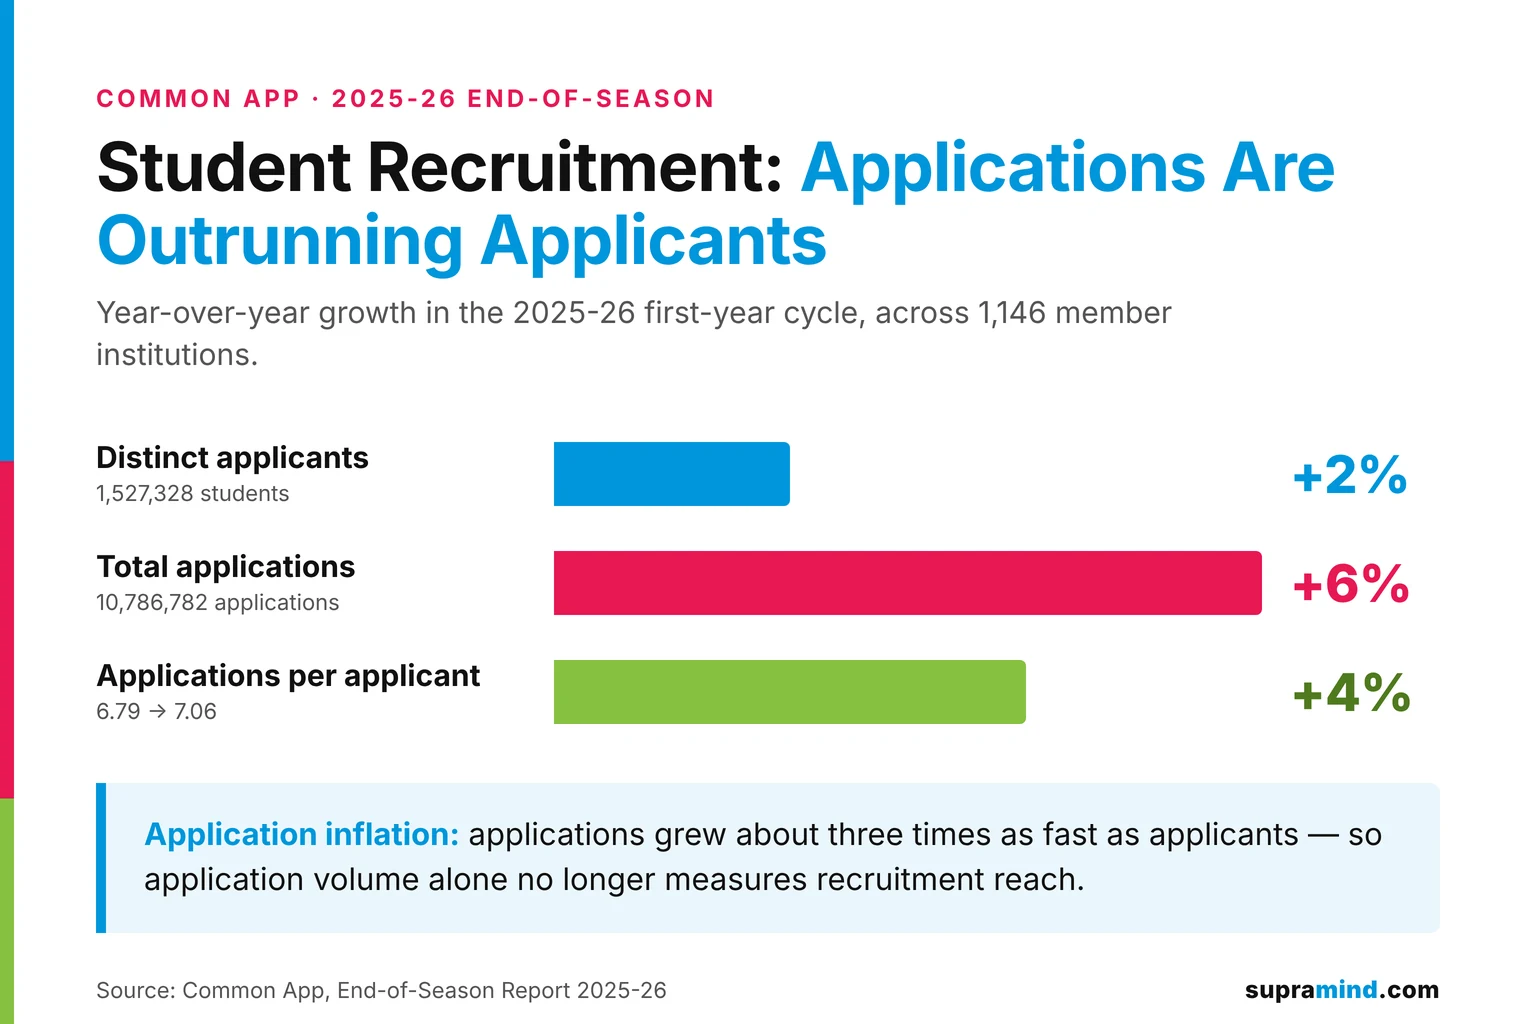
| Total applications | 10,786,782; +6% YoY | Applications grew about three times as fast as applicants |
| Applications per applicant | 6.79 to 7.06; +4% | Students are applying more widely |
| Members with lower application volume | 41.3% | Aggregate market growth did not reach every institution |
| Account creators intending to enroll the following year | 2,564,311 to 2,560,533; <1% decline | First year-over-year decline in this series since 2016-17 |
The key recruitment lesson is simple: more applications across the market do not necessarily mean more students are entering the market.
Common App 2025-26Applicants vs. Applications, 2025-26
- +2%Distinct applicants
- +6%Total applications
- +4%Applications per applicant
The Application Inflation Problem
An average Common App applicant submitted 7.06 applications in 2025-26, up from 6.79 the previous season.
The longer-term comparison makes the pattern clearer. Since 2016-17, Common App reports:
- +77%Account creators
- +70%Applicants
- +154%Applications
- +49%Applications per applicant
Applications have therefore grown more than twice as fast as applicants over this period.
This is often described as application inflation: application counts rise partly because each applicant is submitting to more institutions, not only because the applicant pool is expanding.
A simplified example shows why this matters.
| Metric | Year 1 | Year 2 |
|---|---|---|
| Students considering the college | 10,000 | 10,000 |
| Applications received | 4,000 | 4,400 |
Same pool, +10% applications. If students are applying more widely, the college's application dashboard can improve without an equivalent increase in the number of students considering it.
That means application growth by itself cannot tell a college whether it became more discoverable, gained share of consideration, or simply benefited from broader applying behavior.
The US Demographic Outlook
The demographic challenge is real, but the commonly used “cliff” metaphor can make the change sound more immediate than the primary data suggests.
The Western Interstate Commission for Higher Education projects that the US reached a record high of about 3.9 million high school graduates in 2025, followed by a steady decline to about 3.4 million in 2041, roughly 13% below the peak.
| Period | Approximate US high school graduates | Interpretation |
|---|---|---|
| 2025 | 3.9 million | Projected peak |
| 2041 | 3.4 million | About 13% below the peak |
WICHE projectionsUS High School Graduate Outlook, 2025-2041
- 3.9M2025 — projected peak
- 3.4M2041 — about 13% below the peak
The strategic implication is more useful than the headline. Colleges have time to adapt, but relying on a naturally expanding pool of traditional college-age students becomes progressively less viable. Recruitment strategy needs to consider where applicant growth is occurring, not only the national total.
Where Applicant Growth Is Happening
Common App's 2025-26 end-of-season data shows materially different growth rates across applicant groups and locations.
| Applicant segment | YoY change | Recruitment implication |
|---|---|---|
| Fee-waiver eligible applicants | +6% | Financially sensitive audiences are growing faster |
| Below-median-income ZIP codes | +8% | Cost and aid information becomes increasingly important |
| First-generation applicants | +6% | Discovery content should answer foundational admissions questions clearly |
| Continuing-generation applicants | <1% decline | Established recruitment pools cannot be assumed to grow |
| Small-town applicants | +9% | Recruitment targeting should extend beyond major metros |
| Rural applicants | +8% | Digital discovery can reduce dependence on physical recruitment reach |
| Metropolitan applicants | +3% | Still the largest pool, but growing more slowly |
| International applicants | -10% | International recruitment needs a separate market strategy |
International performance was especially uneven: applicants from Asia declined 11%, Africa 17%, and India 15%. These figures should not be treated as a reason to abandon international recruitment; they show why international markets should be planned separately rather than folded into the domestic strategy.
A Practical Recruitment Opportunity Matrix
| Market condition | Recommended response |
|---|---|
| Applicant demand growing + visibility strong | Defend and expand |
| Applicant demand growing + visibility weak | Highest discovery opportunity |
| Applicant demand declining + visibility strong | Protect efficiently |
| Applicant demand declining + visibility weak | Reassess investment |
How do you decide whether visibility is strong or weak?
For a priority market or program, build a small non-brand keyword set representing how students actually search. Track the institution's share of Top 10 rankings, search impressions, clicks and program-page visits by geography where data allows. Compare the same measures with relevant competitors and with the previous recruitment cycle.
The goal is not to create a single “visibility score.” It is to determine whether growing student demand is translating into discoverability for your institution.
Turning Demographic Segments Into Observable Search Signals
Search data cannot reliably identify a student's income or first-generation status. Recruitment teams should therefore use intent and geographic proxies rather than pretending demographic attributes can be read directly from a dashboard.
| Segment | Observable proxy | Example analysis |
|---|---|---|
| Rural / small-town | Location-specific rank tracking and GA4 city data where consented | Track priority program searches in selected rural and small-town markets |
| First-generation | Foundational admissions, FAFSA, first-generation scholarship and application-help queries | Measure visibility for information needs disproportionately relevant to students navigating admissions without family experience |
| Fee-waiver / lower-income | Cost, net price, aid, fee waiver and scholarship queries | Audit whether accurate affordability information appears early in search |
| Out-of-state prospects | Program + state/city and “best program” discovery queries | Compare visibility outside the institution's historical home market |
These are intent proxies, not demographic identification. Their value is operational: they give recruitment and search teams something observable to improve.
Why Discovery Should Be a Recruitment Priority
Much student recruitment advice begins after a prospective student already knows an institution exists: personalize communication, organize campus events, use student ambassadors, improve email nurturing, deploy a CRM and create authentic social content.
These tactics can matter. None solves the problem of a student never discovering the institution in the first place.
Think of recruitment as a discovery funnel.
| Stage | Student behavior | Recruitment question |
|---|---|---|
| Discovery | Searches programs, careers, subjects and locations | Can they find us? |
| Exploration | Visits program and decision-support pages | Do we answer their questions? |
| Inquiry | Requests information, downloads material or contacts admissions | Are visitors becoming identifiable prospects? |
| Application | Starts or submits an application | Are prospects progressing? |
| Post-application | Offer, acceptance and enrollment | Separate yield problem |
For this article, recruitment ends at application. Admitted-student communication, melt prevention and offer acceptance should be measured as enrollment/yield work rather than blended into discovery-stage recruitment.
Supramind education case evidence
In an education-category engagement, Supramind's work included on-page remediation, duplicate-content cleanup, website redesign and redevelopment, a domain migration and education-relevant backlink acquisition. The approved tracked-ranking evidence shows average position moving from 89.43 to 40.96.
Average position depends on the tracked keyword set, and about 41 is not yet page-one visibility. What it shows is movement from effectively invisible to a range where page-level gains become achievable. It is not evidence of applications or enrollments.
If program discovery is the weak point in your recruitment funnel, see Supramind's Higher Education SEO approach for program architecture, technical SEO, content and search/AI visibility.
A Practical AI Visibility Audit for Student Recruitment
AI-assisted search is becoming another research surface for prospective students. Hanover Research's 2026 National Admitted Student Survey found that 43% of admitted students used AI tools during their college search, rising to 68% among graduate students. Because the respondents had already been admitted, these figures should not be treated as a measurement of all discovery-stage prospects.
Instead of stopping at “AI matters,” colleges can test their own visibility.
Run a 10-prompt audit
- Step 1: Choose five priority programs.
- Step 2: Create two realistic prospective-student prompts for each program.
- Step 3: Run each prompt at least twice in ChatGPT and Gemini using a fresh, logged-out or memory-off session where possible, and record whether the results differ between runs.
- Step 4: Record whether the institution appears.
- Step 5: Check whether program facts, tuition/fees, deadlines and test requirements are stated correctly.
- Step 6: Record competing institutions that appear repeatedly.
- Step 7: Record the sources cited or referenced in the answer.
Example prompts:
- Which universities offer strong cybersecurity bachelor's programs in Texas?
- What are affordable data science master's programs for working professionals?
- Which colleges offer nursing programs near [market] and what are their admission requirements?
- Compare [program category] options based on cost, duration and entry requirements.
| AI audit field | What to record |
|---|---|
| Institution included? | Yes / No |
| Priority program included? | Yes / No |
| Facts accurate? | Accurate / Partly accurate / Incorrect |
| Own website used as source? | Yes / No |
| Third-party source used? | Source/domain |
| Competitors included | Institution names |
| Missing information | Fee, deadline, test policy, curriculum, location, etc. |
A recurring pattern worth watching is whether AI systems rely on third-party aggregators when the institution's own pages are incomplete, difficult to retrieve or unclear. That creates an actionable content and authority question rather than a vague “GEO” objective.
How Student Search Behavior Is Changing
Test-score reporting has reversed direction
Common App reported an 11% increase in applicants reporting test scores, while non-reporters declined 5%. Score reporters outnumbered non-reporters for the first time since 2019-20 even though only 5% of Common App members required a test score.
This turns test policy into a discovery asset, not merely an admissions-policy footnote. Prospective students need clear answers to questions such as:
- Is the program test optional?
- Are scores recommended even if optional?
- Do scores affect scholarships?
- Are requirements different for particular programs?
- Has the policy changed for this admissions cycle?
Competitive sets are widening
Students are also applying across institutional and geographic categories. In the 2025-26 end-of-season data, applications to public members grew 7% compared with 5% at private members. Common App also recorded growth among applicants applying to a mix of in-state/out-of-state and public/private institutions.
The implication: an institution's digital competitors may not match the peer set used in traditional admissions reporting. Search the queries students use and see which institutions repeatedly appear. Those are competitors for discovery, regardless of sector or geography.
The Seven Student Recruitment Strategies in Detail
1. Measure discovery separately from applications
Track non-brand impressions, program-level rankings, organic program visits and inquiries before interpreting application totals. As applications per student rise, an application becomes a weaker proxy for consideration share.
2. Build recruitment around program-level demand
Students often discover an institution through what they want to study rather than through its brand name.
Map the journeySubject → Program → Career outcome → Eligibility → Cost/aid → Location → Application
Program pages should own program intent. Supporting articles should answer adjacent questions and lead students toward the appropriate program page rather than competing with it.
3. Reallocate recruitment by applicant growth
Compare your geographic recruitment footprint with current applicant trends. Growing small-town, rural, first-generation and lower-income segments should not automatically receive the same investment or messaging as mature metropolitan markets.
The goal is not to chase every growing segment. It is to find the intersection of:
- applicant demand,
- program fit,
- geographic feasibility,
- current visibility, and
- inquiry/application quality.
4. Audit what prospective students can actually find
For each priority program, test whether a student can quickly find:
- curriculum and program structure,
- eligibility,
- tuition and fees,
- scholarships and aid,
- test requirements,
- application deadlines,
- career outcomes,
- campus/location information, and
- international requirements where relevant.
Test this through normal search and through AI-assisted research.
5. Redefine your competitive set
Build competitor lists from actual student queries. If an out-of-state public university repeatedly appears above a regional private college for a high-value program search, it is a discovery competitor even if it never appears in the college's traditional peer list.
6. Make critical recruitment information machine-readable and easy to access
Do not make a PDF or image the only authoritative source for program requirements, fees, deadlines or admissions policies. Essential information should also exist as crawlable, structured webpage content that can be found by students, search engines and retrieval systems.
7. Treat standard recruitment channels as table stakes
Email, CRM segmentation, campus events, student ambassadors, social media and personalized messaging still matter. But they mostly influence students after the institution has entered their awareness or consideration set.
Use them to deepen interest. Do not use them as a substitute for discovery.
How to Measure Student Recruitment Without Being Misled by Application Volume
| Funnel level | Useful metrics | What it diagnoses |
|---|---|---|
| Market demand | Search demand, geographic and applicant-segment trends | Is the opportunity expanding? |
| Discovery | Non-brand impressions, program rankings, AI visibility | Are students finding us? |
| Engagement | Program visits, engaged sessions, repeat visits | Are they exploring us? |
| Inquiry | RFI forms, brochure downloads, calls, counselor bookings | Are anonymous visitors becoming prospects? |
| Application | Application starts and submissions | Are prospects progressing? |
| Yield | Offers accepted and enrollments | Measure separately from recruitment |
The most useful signal is the relationship between levels.
Applications up while non-brand discovery declines may indicate that existing prospects are applying more broadly.
Non-brand discovery up, program visits up, inquiries up and applications up provides stronger evidence that recruitment reach itself is expanding.
Frequently Asked Questions
What is a student recruitment strategy?
A student recruitment strategy is the coordinated plan a college or university uses to become discoverable to prospective students, communicate its programs and value, generate inquiries and move suitable prospects toward application.
What is application inflation?
Application inflation is the increase in total college applications caused partly by individual applicants submitting to more institutions, rather than by equivalent growth in the number of applicants. In Common App's 2025-26 cycle, applicants grew 2% while applications grew 6%, and applications per applicant increased from 6.79 to 7.06.
What are the most effective student recruitment strategies?
There is no universal channel mix. Colleges should identify programs and markets where prospective-student demand exists but institutional visibility is weak, improve discovery and program information, then combine those efforts with targeted outreach, events, CRM communication and student engagement.
How can colleges attract more students?
Start by separating discovery from conversion. Identify programs and markets with demand, determine whether prospective students can find the institution through non-brand search and AI-assisted research, improve the information available during consideration, and measure inquiry and application progression.
Is SEO useful for student recruitment?
SEO can help prospective students discover programs and institutions while researching subjects, careers, courses, locations, eligibility, cost and admissions questions. Its contribution should be measured through visibility, relevant traffic and inquiries rather than automatically attributing enrollments to SEO.
Is AI changing student recruitment?
Hanover Research's 2026 National Admitted Student Survey found 43% of admitted students used AI tools during their college search, rising to 68% among graduate students. Because the sample consisted of admitted students, these figures should not be interpreted as the percentage of all prospective students using AI. Institutions can still audit whether they appear accurately for realistic student prompts and which sources AI systems use.
Should application volume be the main recruitment KPI?
No. Application volume remains useful, but it should be interpreted alongside applicant reach, non-brand discovery, program engagement and inquiries. When students submit more applications, total application counts can rise without equivalent growth in the underlying applicant population.
Sources and Editorial References
- 1. Common App, End-of-season report, 2025-2026: First-year application trends. Data Analytics and Research, August 20, 2026.
- 2. Western Interstate Commission for Higher Education, Knocking at the College Door, 11th Edition, December 2024.
- 3. Hanover Research, 2026 National Admitted Student Survey, June 17, 2026.
- 4. Supramind, education-category client engagement (anonymized).
- Log in to post comments


 INDIA
INDIA